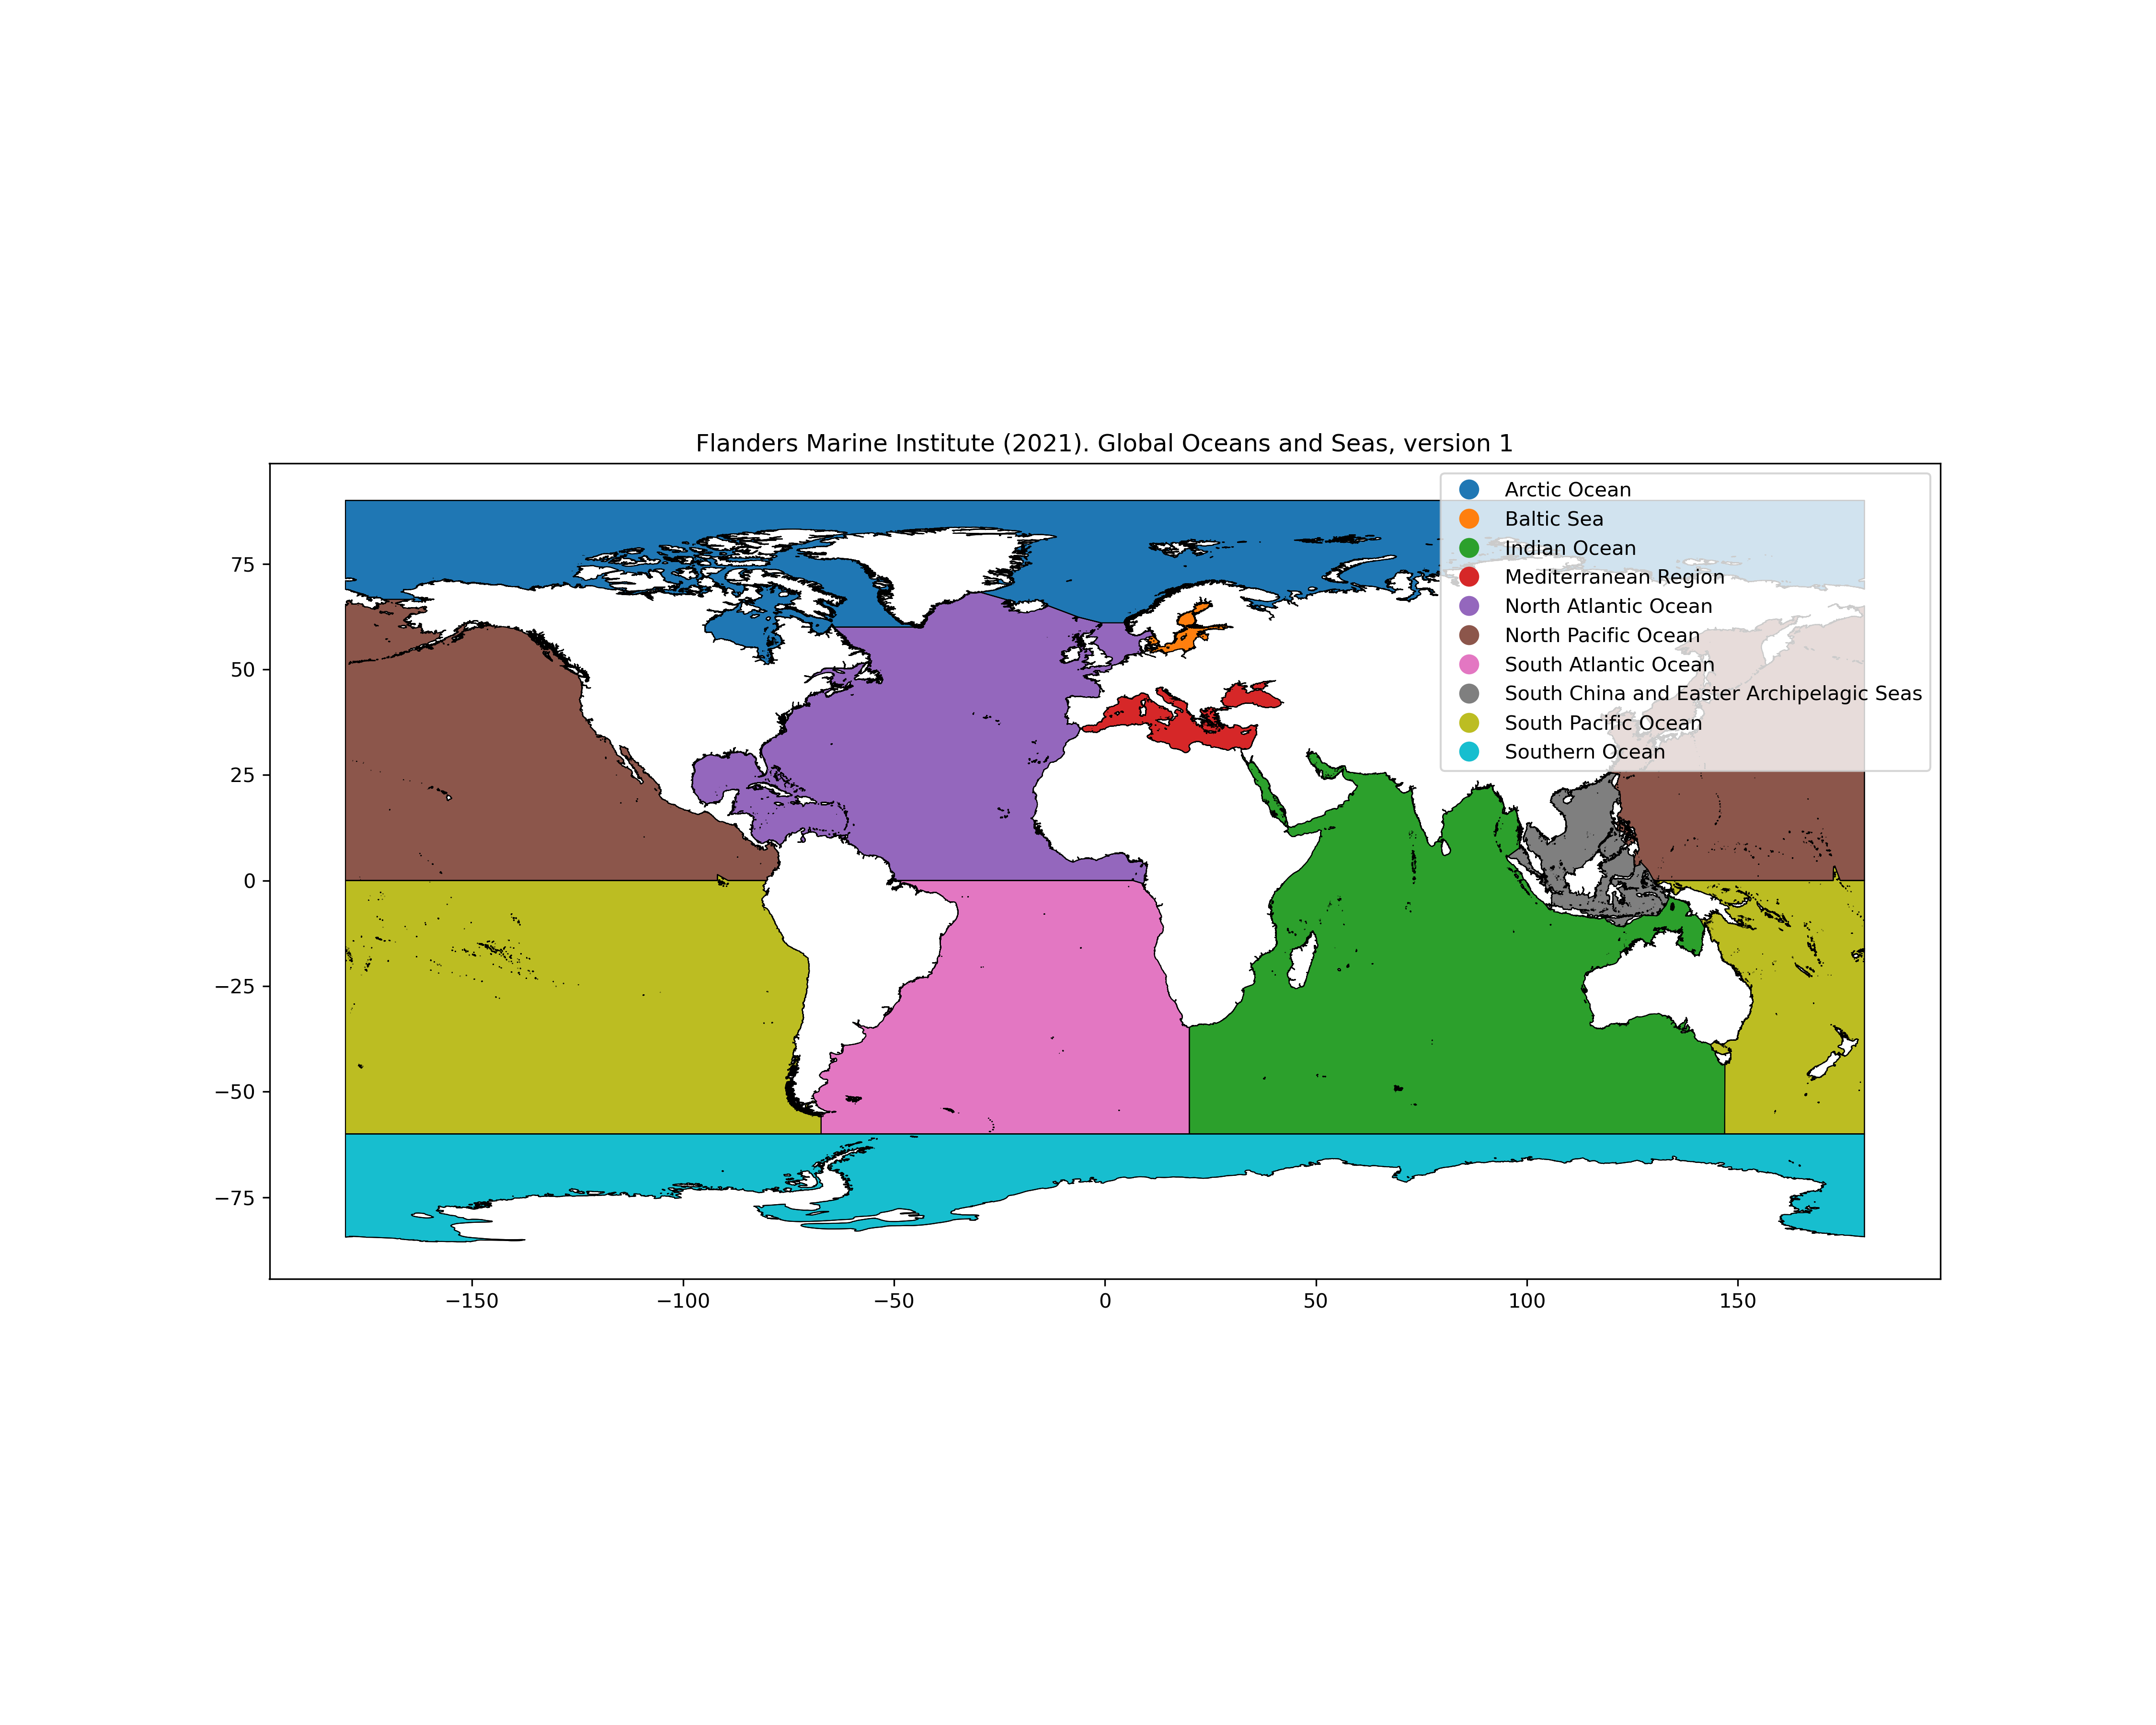
MarineRegions.org Global Oceans and Seas v01
Flanders Marine Institute (2021). Global Oceans and Seas, version 1. Available online at https://www.marineregions.org/. https://doi.org/10.14284/542
import geopandas as gpd
import matplotlib.pyplot as plt

# Read the shapefile
shapefile_path = "goas_v01.shp"
data = gpd.read_file(shapefile_path)

# Plot the shapefile with borders and labels
fig, ax = plt.subplots(figsize=(15, 12))
data.boundary.plot(ax=ax, color='black', linewidth=0.5)
data.plot(ax=ax, column='name', edgecolor='black', linewidth=0.5, legend=True)

# Set plot title
plt.title('Flanders Marine Institute (2021). Global Oceans and Seas, version 1')

# Save figure
plt.savefig("goas_v01.png", dpi=300)

# Show the plot
plt.show()
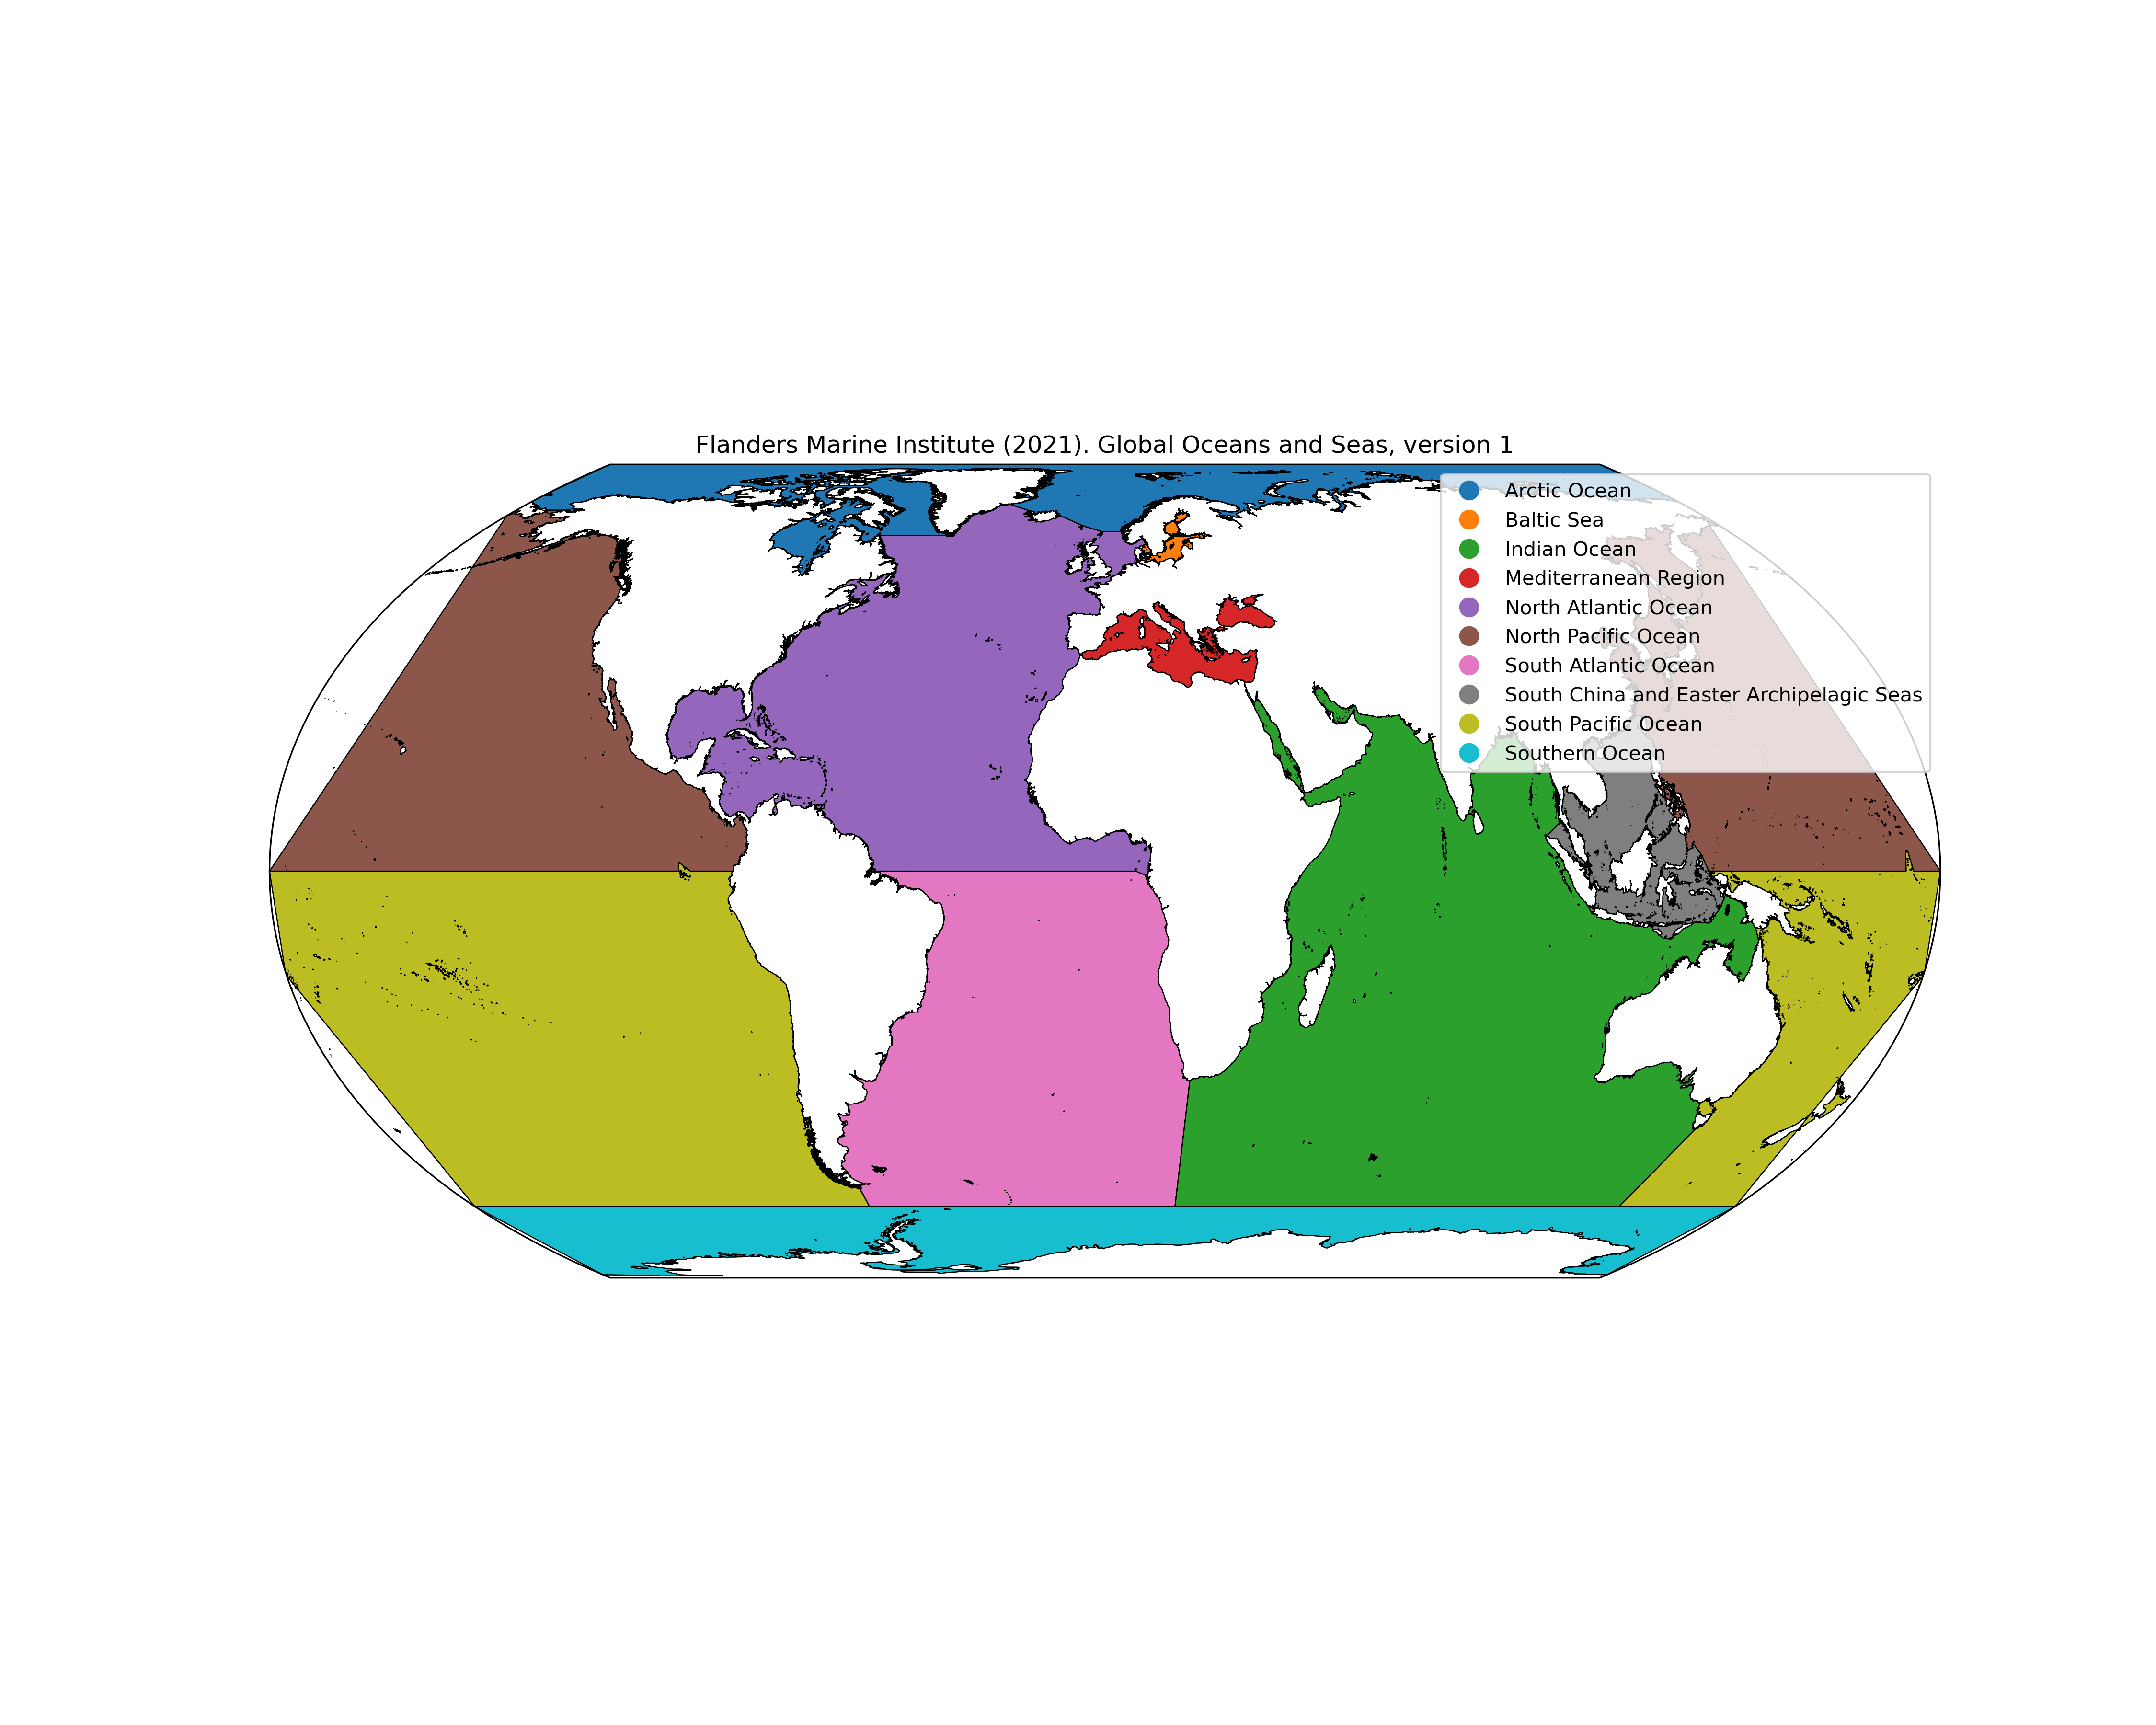
import geopandas as gpd
import matplotlib.pyplot as plt
import cartopy.crs as ccrs

# Read the shapefile
shapefile_path = "goas_v01.shp"
data = gpd.read_file(shapefile_path)

# Create an axes instance with Equal Earth projection
fig, ax = plt.subplots(figsize=(15, 12), subplot_kw={'projection': ccrs.EqualEarth()})
ax.set_global()  # to show the whole earth

# Reproject the geopandas GeoDataFrame to the Equal Earth CRS
data = data.to_crs(ccrs.EqualEarth().proj4_init)

# Plot the shapefile with borders and labels
data.boundary.plot(ax=ax, color='black', linewidth=0.5, transform=ccrs.EqualEarth())
data.plot(ax=ax, column='name', edgecolor='black', linewidth=0.5, legend=True, transform=ccrs.EqualEarth())

# Set plot title
plt.title('Flanders Marine Institute (2021). Global Oceans and Seas, version 1')

# Save figure
plt.savefig("goas_v01_EqualEarth.png", dpi=300)

# Show the plot
plt.show()