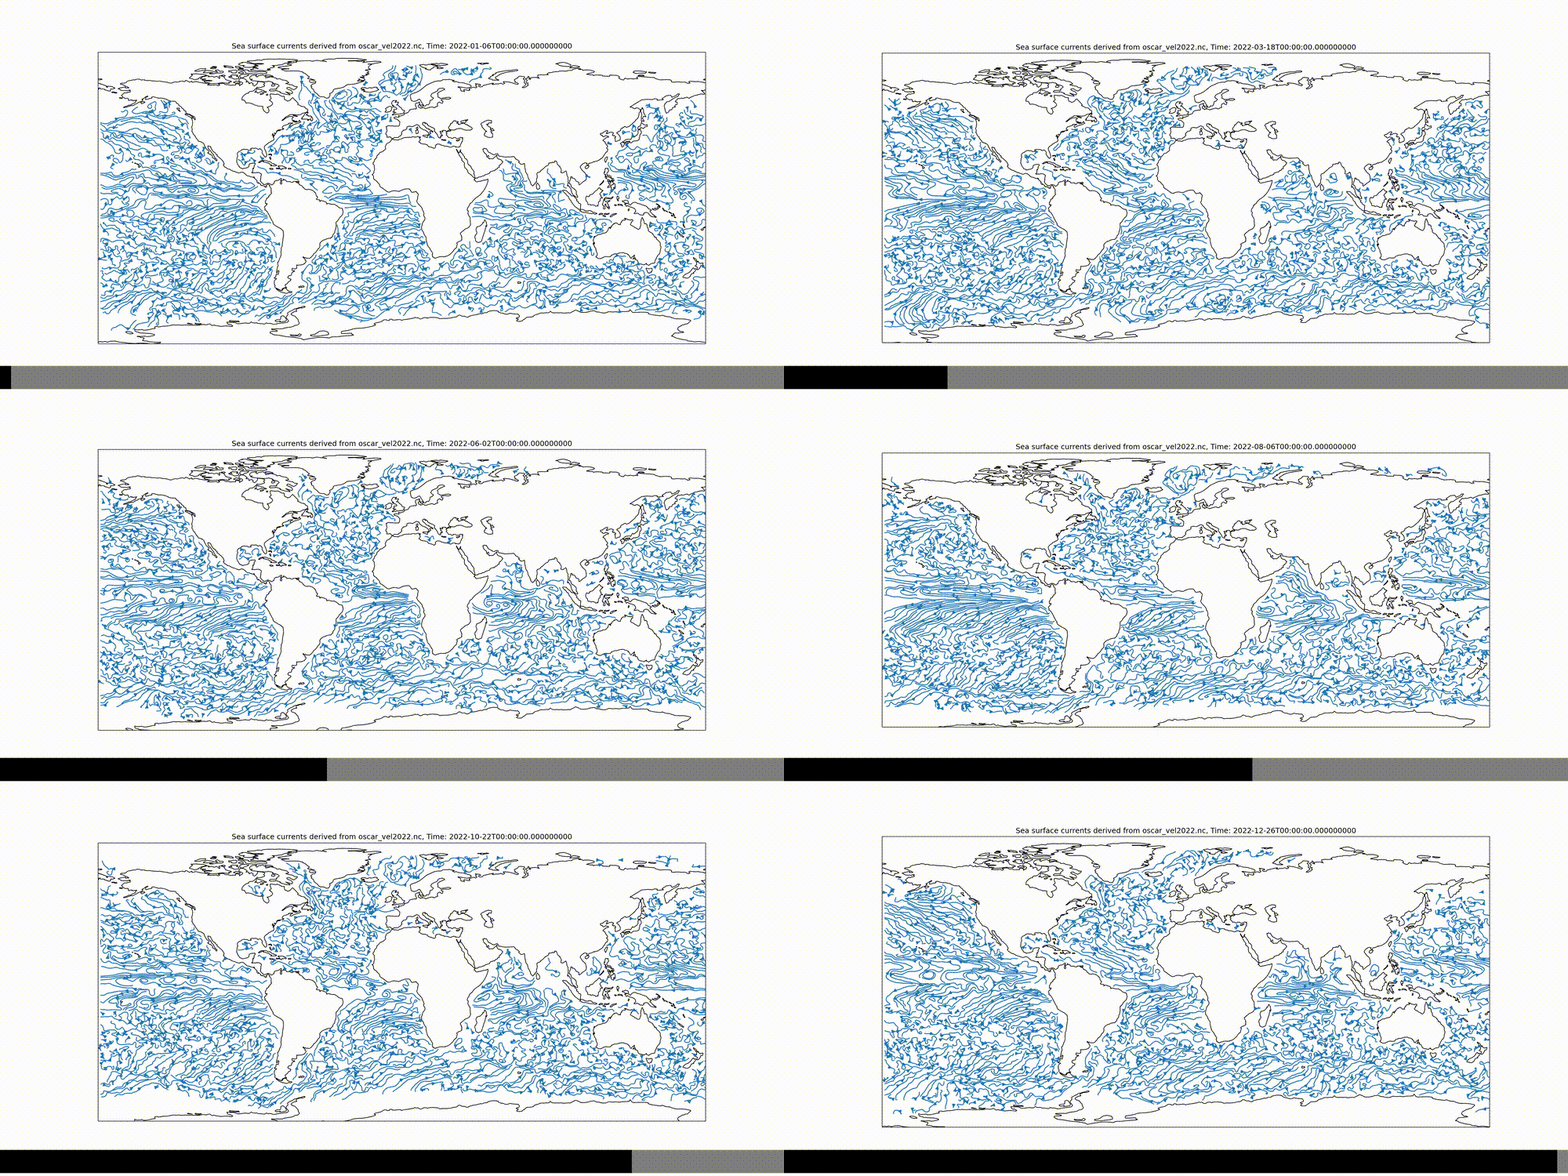
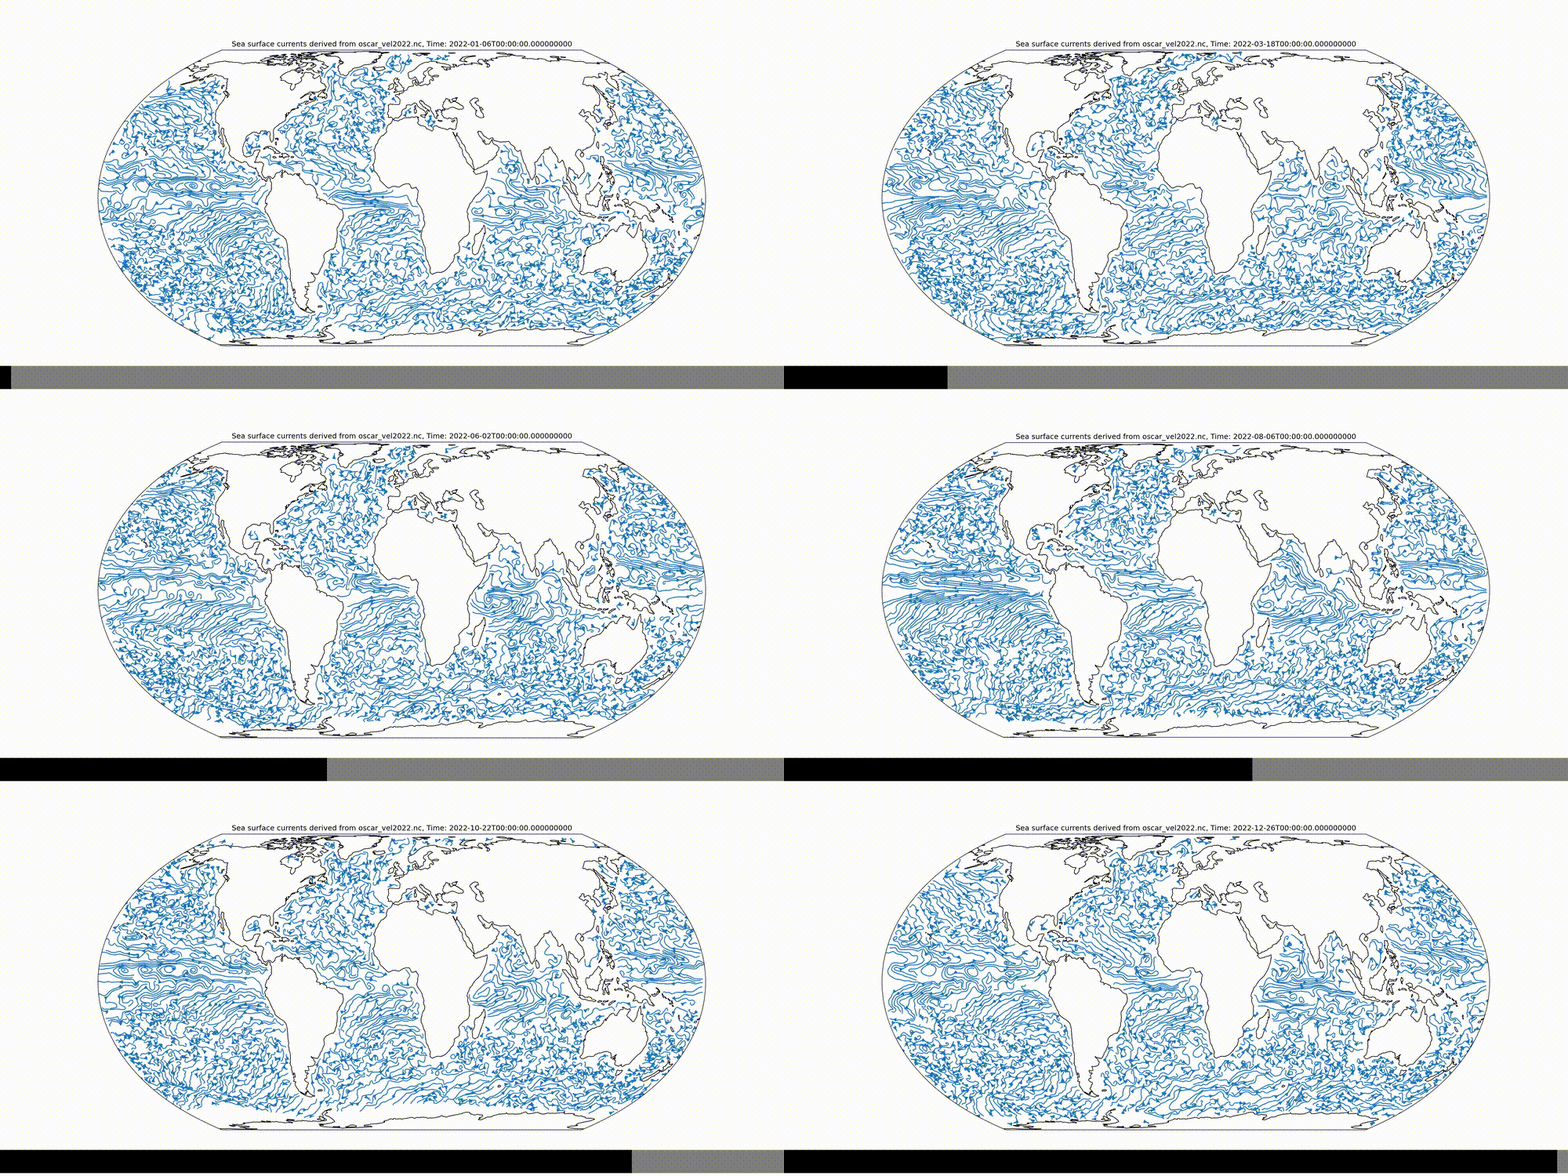
OSCAR 2022 sea surface velocity streamplot animation
https://podaac.jpl.nasa.gov/dataset/OSCAR_L4_OC_third-deg
#Import packages
import earthaccess

#Authentication with Earthdata Login
auth = earthaccess.login(strategy="netrc")

results = earthaccess.search_data(short_name="OSCAR_L4_OC_third-deg_YEARLY",
                                  version="1",
                                  cloud_hosted=True,
                                  temporal = ("2022-01-01","2022-07-31"),
                                  bounding_box = (-51.96423,68.10554,-48.71969,70.70529))

earthaccess.download(results, "./local_folder")
import xarray as xr
# Open the dataset
ds = xr.open_dataset("local_folder/oscar_vel2022.nc")
Plate carrée projection
import numpy as np
import cartopy.crs as ccrs
import matplotlib.pyplot as plt
import os

dec = 2 # decimation

# Create a directory for the images if it doesn't exist
output_dir = "oscar_images"
os.makedirs(output_dir, exist_ok=True)

for t in range(len(ds.time)):
    plt.figure(figsize=(18, 9))
    ax = plt.axes(projection=ccrs.PlateCarree()) # plate carrée projection

    lon = ds.longitude.values[::dec]
    lon[lon > 180] = lon[lon > 180] - 360

    plt.streamplot(
        lon,
        ds.latitude.values[::dec],
        ds.u.values[t, 0, ::dec, ::dec],
        ds.v.values[t, 0, ::dec, ::dec],
        8,
        transform = ccrs.PlateCarree()
    )

    ax.coastlines()

    # Create a title using the time dimension
    plt.title(f'Sea surface currents derived from oscar_vel2022.nc, Time: {ds.time.values[t]}')

    # Save the figure with a filename based on the time step
    plt.savefig(f"{output_dir}/oscar_vel2022_t{t}.png", dpi=150)

    # Close the figure to free up memory
    plt.close()
#!/bin/bash

# Define total number of time steps
N=72

# Define output directory
output_dir="ffmpeg"

# Create output directory if it doesn't exist
mkdir -p $output_dir

# Define width and height
width=2700
height=1350

# Define progress bar height
progress_height=80

# Create N images with increasing filled progress bars
for i in $(seq 1 $N); do
    progress=$((i*width/N))  # proportionally increase size
    convert -size ${width}x${progress_height} xc:grey50 -fill "rgb(0,0,0)" -draw "rectangle 0,0 $progress,${progress_height}" ${output_dir}/progress_${i}.png
done

# Overlay progress bar onto each image, create new image
for i in $(seq 1 $N); do
    # Calculate progress bar position
    y_offset=$(( height-progress_height-10 ))  # place the progress bar at the bottom, with 10 pixels padding

    # Overlay progress bar and save as new image
    convert oscar_vel2022_t${i}.png ${output_dir}/progress_${i}.png -geometry +0+${y_offset} -composite ${output_dir}/oscar_vel2022_progress_t${i}.png
done

# Create video using ffmpeg
ffmpeg -framerate 5 -i "${output_dir}/oscar_vel2022_progress_t%d.png" -c:v libx264 -r 30 -pix_fmt yuv420p ${output_dir}/oscar_vel2022.mp4

# Clean up progress bar and composite images
rm ${output_dir}/progress_*.png
rm ${output_dir}/oscar_vel2022_progress_t*.png
ffmpeg -i ffmpeg/oscar_vel2022.mp4 -vf "fps=3,scale=1000:-1:flags=lanczos" -c:v gif ffmpeg/oscar_vel2022.gif

Peters projection
import numpy as np
import cartopy.crs as ccrs
import matplotlib.pyplot as plt
import os

dec = 2 # decimation

# Create a directory for the images if it doesn't exist
output_dir = "output_Peters"
os.makedirs(output_dir, exist_ok=True)

for t in range(len(ds.time)):
    plt.figure(figsize=(18, 9))
    ax = plt.axes(projection=ccrs.EqualEarth()) # Equal Earth (similar to Peters) projection

    lon = ds.longitude.values[::dec]
    lon[lon > 180] = lon[lon > 180] - 360

    plt.streamplot(
        lon,
        ds.latitude.values[::dec],
        ds.u.values[t, 0, ::dec, ::dec],
        ds.v.values[t, 0, ::dec, ::dec],
        8,
        transform = ccrs.PlateCarree()
    )

    ax.coastlines()

    # Create a title using the time dimension
    plt.title(f'Sea surface currents derived from oscar_vel2022.nc, Time: {ds.time.values[t]}')

    # Save the figure with a filename based on the time step
    plt.savefig(f"{output_dir}/oscar_vel2022_t{t}.png", dpi=150)

    # Close the figure to free up memory
    plt.close()
#!/bin/bash

# Define total number of time steps
N=72

# Define output directory
output_dir="ffmpeg_Peters"

# Create output directory if it doesn't exist
mkdir -p $output_dir

# Define width and height
width=2700
height=1350

# Define progress bar height
progress_height=80

# Create N images with increasing filled progress bars
for i in $(seq 1 $N); do
    progress=$((i*width/N))  # proportionally increase size
    convert -size ${width}x${progress_height} xc:grey50 -fill "rgb(0,0,0)" -draw "rectangle 0,0 $progress,${progress_height}" ${output_dir}/progress_${i}.png
done

# Overlay progress bar onto each image, create new image
for i in $(seq 1 $N); do
    # Calculate progress bar position
    y_offset=$(( height-progress_height-10 ))  # place the progress bar at the bottom, with 10 pixels padding

    # Overlay progress bar and save as new image
    convert oscar_vel2022_t${i}.png ${output_dir}/progress_${i}.png -geometry +0+${y_offset} -composite ${output_dir}/oscar_vel2022_progress_t${i}.png
done

# Create video using ffmpeg
ffmpeg -framerate 5 -i "${output_dir}/oscar_vel2022_progress_t%d.png" -c:v libx264 -r 30 -pix_fmt yuv420p oscar_vel2022.mp4

# Clean up progress bar and composite images
rm ${output_dir}/progress_*.png
rm ${output_dir}/oscar_vel2022_progress_t*.png
ffmpeg -i oscar_vel2022_peters.mp4 -vf "fps=3,scale=1000:-1:flags=lanczos" -c:v gif oscar_vel2022_peters.gif
