Transforming and exploring ping output with awk, bc and Gnuplot
ping
ping -D -c 3600 -i 1 google.com.com > Google-3600A
Manually delete first line from Google-3600A.
head -n 5 Google-3600A
[1672984648.605701] 64 bytes from yyz12s07-in-f14.1e100.net (142.251.32.78): icmp_seq=1 ttl=114 time=4.36 ms
[1672984649.607109] 64 bytes from yyz12s07-in-f14.1e100.net (142.251.32.78): icmp_seq=2 ttl=114 time=3.78 ms
[1672984650.608478] 64 bytes from yyz12s07-in-f14.1e100.net (142.251.32.78): icmp_seq=3 ttl=114 time=3.38 ms
[1672984651.611088] 64 bytes from yyz12s07-in-f14.1e100.net (142.251.32.78): icmp_seq=4 ttl=114 time=4.49 ms
[1672984652.611526] 64 bytes from yyz12s07-in-f14.1e100.net (142.251.32.78): icmp_seq=5 ttl=114 time=4.21 ms
awk
cat Google-3600A | tr -d ['\[','\]'] | tr '=' ' ' | awk -F " " '{ printf("%d, %d, %s, %.2f\n", NR, $8, $1, $12) }' > Google_A.csv
head -n 5 Google_A.csv
1, 1, 1672984648.605701, 4.36
2, 2, 1672984649.607109, 3.78
3, 3, 1672984650.608478, 3.38
4, 4, 1672984651.611088, 4.49
5, 5, 1672984652.611526, 4.21
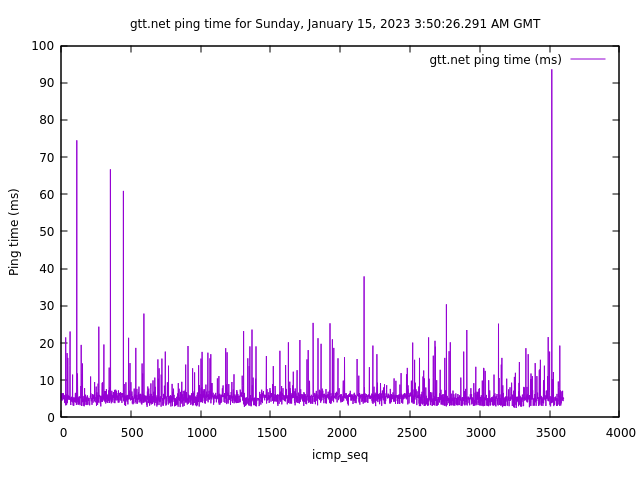
cat GTT-3600A | tr -d ['\[','\]'] | tr '=' ' ' | awk -F " " '{ printf("%d, %d, %s, %.2f\n", NR, $8, $1, $12) }' > GTT_A.csv
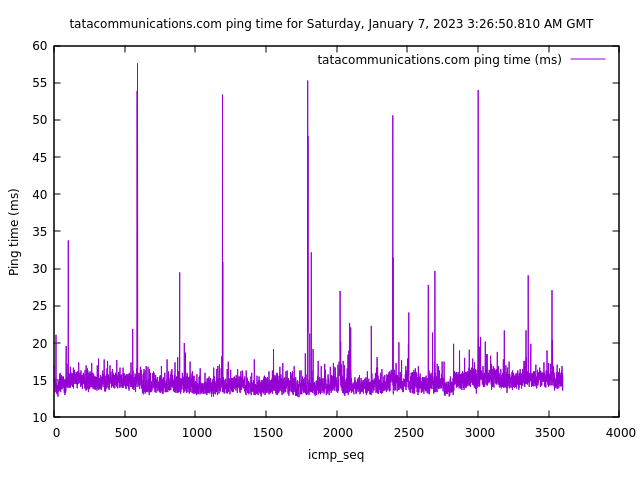
cat Tata-3600A | tr -d ['\[','\]'] | tr '=' ' ' | awk -F " " '{ printf("%d, %d, %s, %.2f\n", NR, $8, $1, $12) }' > Tata_A.csv
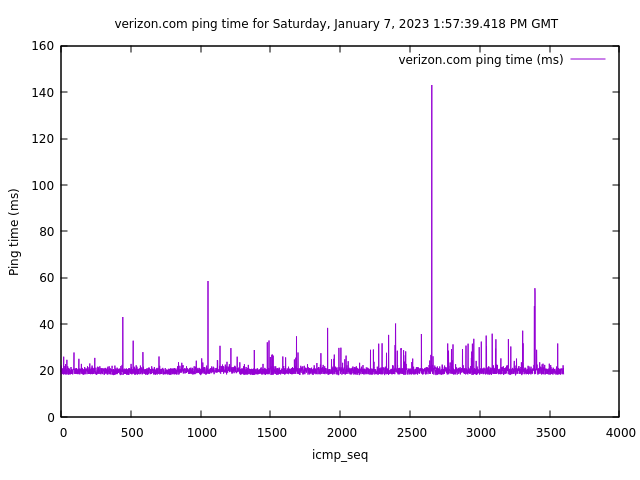
cat Verizon-3600A | tr -d ['\[','\]'] | tr '=' ' ' | awk -F " " '{ printf("%d, %d, %s, %.2f\n", NR, $8, $1, $12) }' > Verizon_A.csv
bc
sum=$(awk '{print $4}' Google_A.csv | paste -sd+ | bc); echo "$sum / $(cat Google_A.csv | wc -l)" | bc -l
4.55408446790775215337
awk 'BEGIN{s=0;}{s+=$4;}END{print s/NR;}' Google_A.csv
4.55408
| Domain | Mean ping (ms) |
|---|---|
| google.com | 4.55408 |
| google.com | 5.81154 |
| google.com | 5.79628 |
| gtt.net | 5.69438 |
| gtt.net | 4.7469 |
| gtt.net | 4.9692 |
| tatacommunications.com | 14.8873 |
| tatacommunications.com | 16.9659 |
| tatacommunications.com | 17.119 |
| verizon.com | 20.2917 |
| verizon.com | 20.7922 |
| verizon.com | 20.5112 |
Gnuplot
set datafile separator ','
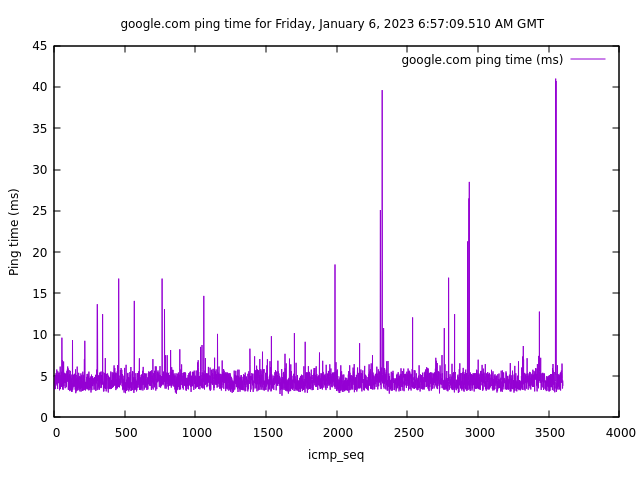
set title 'google.com ping time for Friday, January 6, 2023 6:57:09.510 AM GMT'
set xlabel 'icmp\_seq'
set ylabel 'Ping time (ms)'
plot 'Google_A.csv' using 2:4 with lines title 'google.com ping time (ms)'


