CIHI Health Workforce in Canada, 2017 to 2021
Canadian Institute for Health Information (CIHI)
Health Workforce in Canada, 2017 to 2021: Overview — Data Tables (XLSX)
Data tables Published November 24, 2022
These data tables provide comparable information on 31 groups of health care professionals in Canada, including 5-year trends and demographic information.
health-workforce-canada-2017-2021-overview-data-tables-en.xlsx
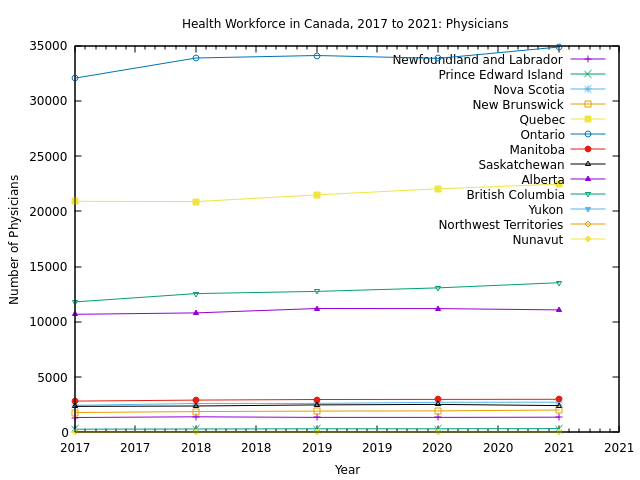
Physician count by province and year (using Tables 1-13):
Health_Workforce_in_Canada_2017_to_2021_Physicians.csv
Year,Newfoundland and Labrador,Prince Edward Island,Nova Scotia,New Brunswick,Quebec,Ontario,Manitoba,Saskatchewan,Alberta,British Columbia,Yukon,Northwest Territories,Nunavut
2017,1347,289,2455,1797,20908,32055,2833,2356,10680,11803,77,35,8
2018,1414,305,2616,1885,20878,33872,2918,2390,10806,12553,77,41,17
2019,1357,323,2624,1923,21485,34091,2979,2484,11205,12757,79,44,21
2020,1361,322,2719,1949,22038,33830,2987,2535,11197,13073,85,52,25
2021,1378,344,2736,2022,22451,34860,2996,2426,11085,13540,85,53,22
Gnuplot:
set datafile separator ','
set timefmt '%Y'
set format x '%Y'
set xdata time
set title 'Health Workforce in Canada, 2017 to 2021: Physicians'
set xlabel 'Year'
set ylabel 'Number of Physicians'
plot for [col=2:14] 'Health_Workforce_in_Canada_2017_to_2021_Physicians.csv' using 1:col with linespoints title columnheader