Cisco Annual Internet Report, 2018–2023 using Gnuplot
March 9, 2020
Table 5. Fixed broadband speeds (in Mbps), 2018–2023
Year,Global,Asia Pacific,Latin America,North America,Western Europe,Central and Eastern Europe,Middle East and Africa
2018,45.9,62.8,15.7,56.6,45.6,35,9.7
2019,52.9,74.9,19.7,70.1,53.2,37.2,11.7
2020,61.2,91.8,34.5,92.7,72.3,57,25
2021,77.4,117.1,41.2,106.8,87.4,65.5,29
2022,97.8,137.4,51.5,126,105.6,77.8,34.9
2023,110.4,157.1,59.3,141.8,123,87.7,41.2
set datafile separator ','
set timefmt '%Y'
set format x '%Y'
set xdata time
set title 'Cisco Annual Internet Report, 2018–2023. Fixed broadband speeds (in Mbps), 2018–2023'
set xlabel 'Year'
set ylabel 'Mbps'
plot for [col=2:8] 'table5.csv' using 1:col with linespoints title columnheader
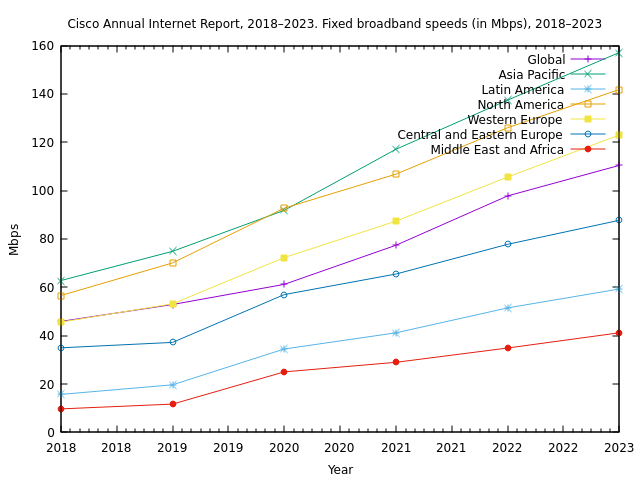
Table 7. Average mobile network connection speeds (in Mbps) by region and country
Year,Global speed: All handsets,Asia Pacific,Latin America,North America,Western Europe,Central and Eastern Europe,Middle East and Africa
2018,13.2,14.3,8,21.6,23.6,12.9,6.9
2019,17.7,18,11.2,27,31.2,15.7,9.4
2020,23.5,24.7,15.7,34.9,40.1,21.3,13.3
2021,29.4,32.4,21.1,42.4,48.2,30.3,17.6
2022,35.9,39,24.8,50.6,54.4,36.1,20.3
2023,43.9,45.7,28.8,58.4,62.4,43,24.8
set datafile separator ','
set timefmt '%Y'
set format x '%Y'
set xdata time
set title 'Cisco Annual Internet Report, 2018–2023. Average mobile network connection speeds (in Mbps)'
set xlabel 'Year'
set ylabel 'Mbps'
plot for [col=2:8] 'table5.csv' using 1:col with linespoints title columnheader
