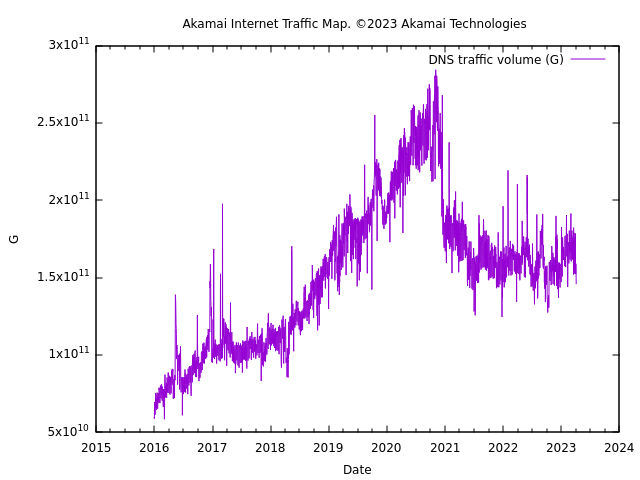
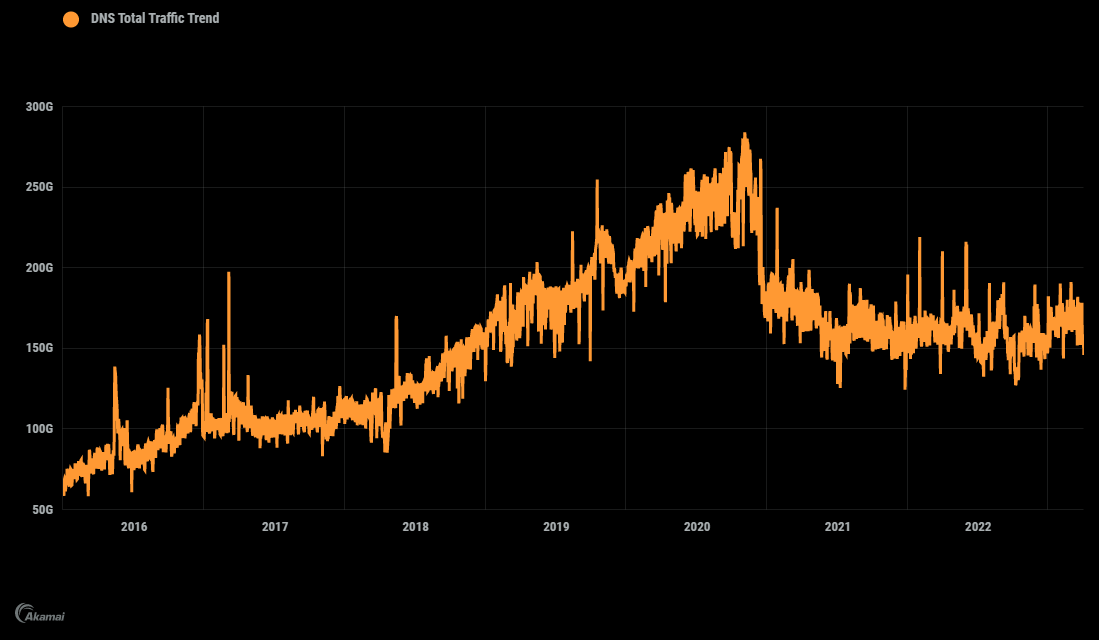
Akamai Internet Traffic Map using Gnuplot
dns_total_traffic_trend.json
head -n 5 dns.csv
Date,DNS Total Traffic Trend (G)
2016-01-01,59412125812
2016-01-02,59686411092
2016-01-03,58831870867
2016-01-04,68714275506
tail -n 5 dns.csv
2020-09-01,22.001,23.334,21.563,13.990,,,
2020-10-01,25.014,26.153,20.322,16.760,,,
2020-11-01,27.710,29.584,20.680,20.136,,,
2020-12-01,25.218,26.595,20.553,18.200,,,
2021-01-01,39.572,40.120,33.726,27.278,,,
set datafile separator ','
set timefmt '%Y-%m-%d'
set format x '%Y'
set xdata time
set title 'Akamai Internet Traffic Map. ©2023 Akamai Technologies'
set xlabel 'Date'
set ylabel 'G'
plot for [col=2:2] 'dns.csv' using 1:col with lines title columnheader

