DHL Global Connectedness Index (GCI) using Gnuplot
DHL Global Connectedness Index (GCI)
DHL Global Connectedness Index (GCI)
DHL Global Connectedness Index | NYU Stern
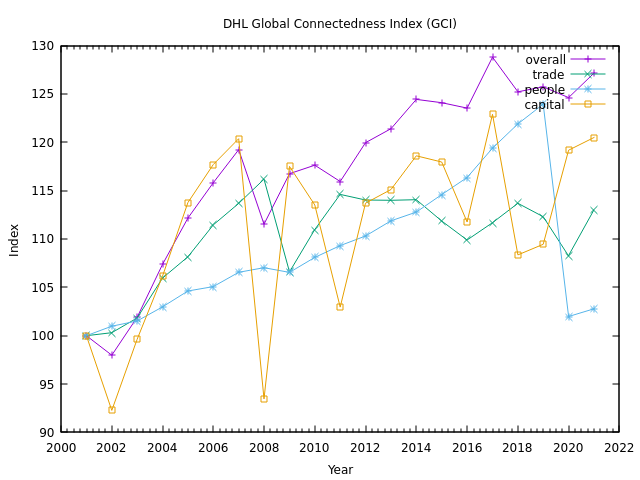
| year | overall | trade | people | capital | information |
|---|---|---|---|---|---|
| 2001 | 100 | 100 | 100 | 100 | 100 |
| 2002 | 97.9827 | 100.3042 | 100.9841 | 92.2775 | 102.8764 |
| 2003 | 101.8877 | 101.8284 | 101.5175 | 99.617 | 107.6942 |
| 2004 | 107.3731 | 105.9474 | 102.9709 | 106.1532 | 117.948 |
| 2005 | 112.1508 | 108.1502 | 104.62 | 113.7601 | 125.2613 |
| 2006 | 115.811 | 111.4536 | 105.075 | 117.6969 | 132.3142 |
| 2007 | 119.2227 | 113.6746 | 106.5525 | 120.362 | 142.1803 |
| 2008 | 111.5256 | 116.1807 | 107.0251 | 93.4586 | 147.3202 |
| 2009 | 116.7468 | 106.5902 | 106.537 | 117.5055 | 148.8848 |
| 2010 | 117.6282 | 110.9778 | 108.0941 | 113.5085 | 152.2923 |
| 2011 | 115.9355 | 114.6023 | 109.3131 | 102.9497 | 155.9691 |
| 2012 | 119.9557 | 114.0315 | 110.3075 | 113.6931 | 158.0399 |
| 2013 | 121.3965 | 114.001 | 111.8809 | 115.1163 | 162.822 |
| 2014 | 124.4323 | 114.0565 | 112.7806 | 118.5952 | 173.9139 |
| 2015 | 124.0903 | 111.851 | 114.5861 | 117.9554 | 176.4677 |
| 2016 | 123.5283 | 109.8912 | 116.3556 | 111.7533 | 189.9962 |
| 2017 | 128.7923 | 111.6763 | 119.3782 | 122.8897 | 191.9167 |
| 2018 | 125.2085 | 113.6816 | 121.8933 | 108.3478 | 194.7614 |
| 2019 | 125.7267 | 112.3004 | 123.9349 | 109.4451 | 196.8371 |
| 2020 | 124.6096 | 108.2383 | 101.9807 | 119.1739 | 198.1216 |
| 2021 | 127.1499 | 112.9659 | 102.7743 | 120.4835 | 200.176 |
Gnuplot
head -n 5 DHL_GCI.csv
year,overall,trade,people,capital,information
2001,100,100,100,100,100
2002,97.9827,100.3042,100.9841,92.2775,102.8764
2003,101.8877,101.8284,101.5175,99.617,107.6942
2004,107.3731,105.9474,102.9709,106.1532,117.948
DHL_GCI.gp
set datafile separator ','
set timefmt '%Y'
set format x '%Y'
set xdata time
set title 'DHL Global Connectedness Index (GCI)'
set xlabel 'Year'
set ylabel 'Index'
plot for [col=2:5] 'DHL_GCI.csv' using 1:col with linespoints title columnheader
gnuplot -p DHL_GCI.gp