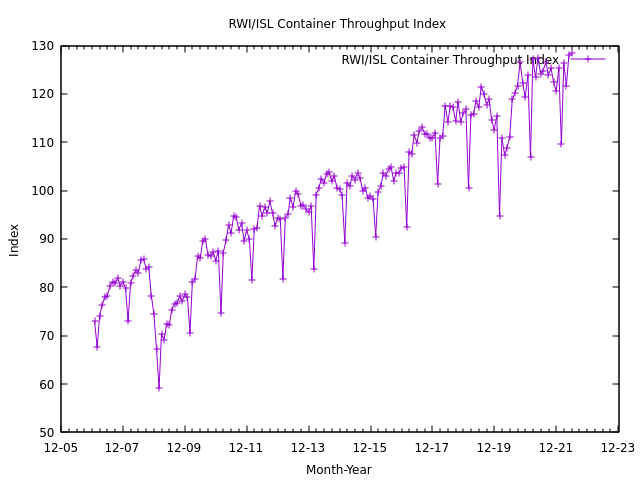
RWI/ISL Container Throughput Index using Gnuplot
RWI/ISL Container Throughput Index
RWI/ISL Container Throughput Index
Since early 2012, the Institute of Shipping Economics and Logistics (ISL) and the RWI – Leibniz-Institut für Wirtschaftsforschung (RWI) are publishing a monthly index for global container throughput which aims to provide reliable conclusions on short term trends in worldwide economic activity. The RWI/ISL Container Throughput Index uses the fact that international trade is primarily handled by ships and containers, which means the container throughput in ports is an important indicator of global trade. Currently, the database consists of 82 international ports covering more than 60% of world container handling. These ports are continuously monitored by the ISL as part of their market analysis.
containerumschlag-index_220729.xlsx
Gnuplot
Time/date specifiers | Gnuplot
head -n 5 ISL.csv
Month,RWI/ISL Container Throughput Index
Jan-07,73.0
Feb-07,67.6
Mar-07,74.1
Apr-07,76.3
ISL.gp
set datafile separator ','
set timefmt '%b-%Y'
set format x '%m-%y'
set xdata time
set title 'RWI/ISL Container Throughput Index'
set xlabel 'Month-Year'
set ylabel 'Index'
plot for [col=2:2] 'ISL.csv' using 1:col with linespoints title columnheader
gnuplot -p ISL.gp
