UK Marine Management Organisation (MMO) AIS Data
MMO 1066
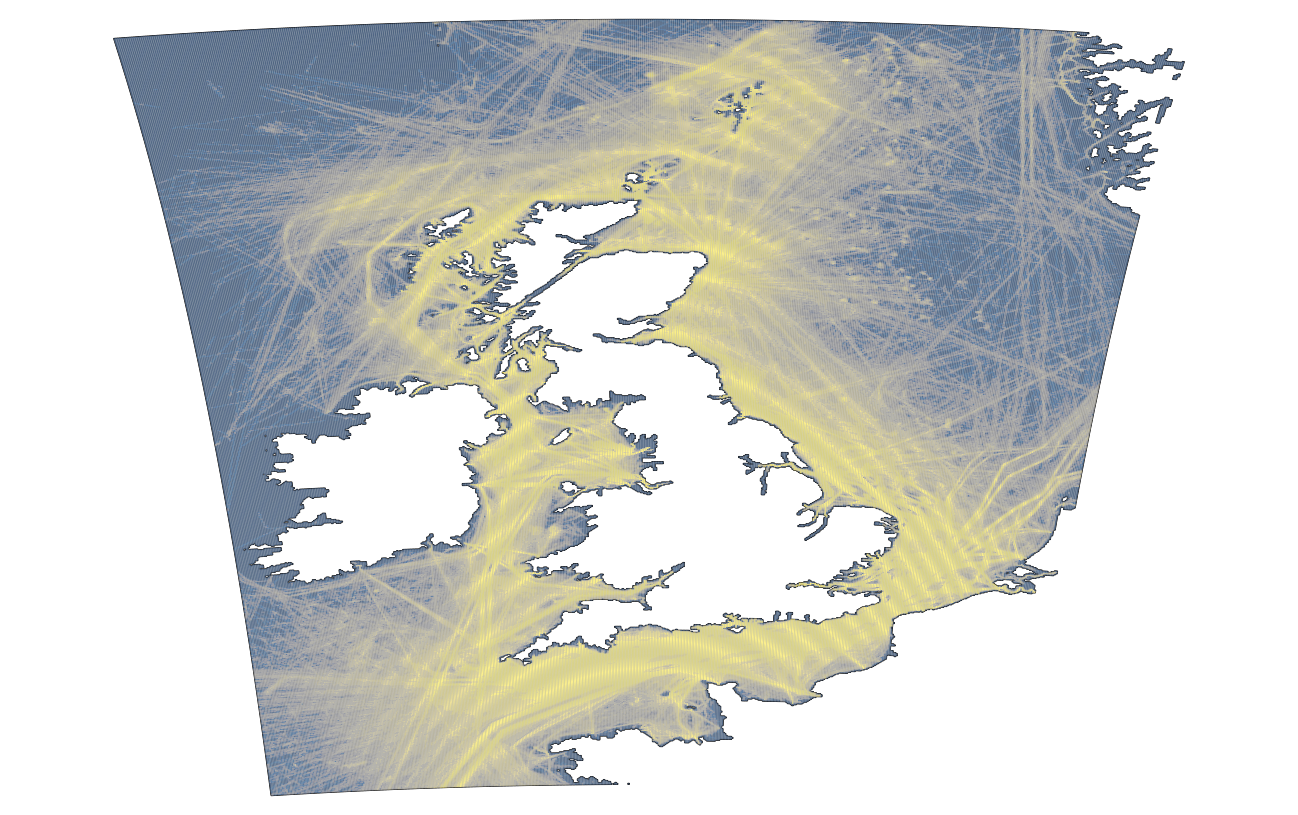
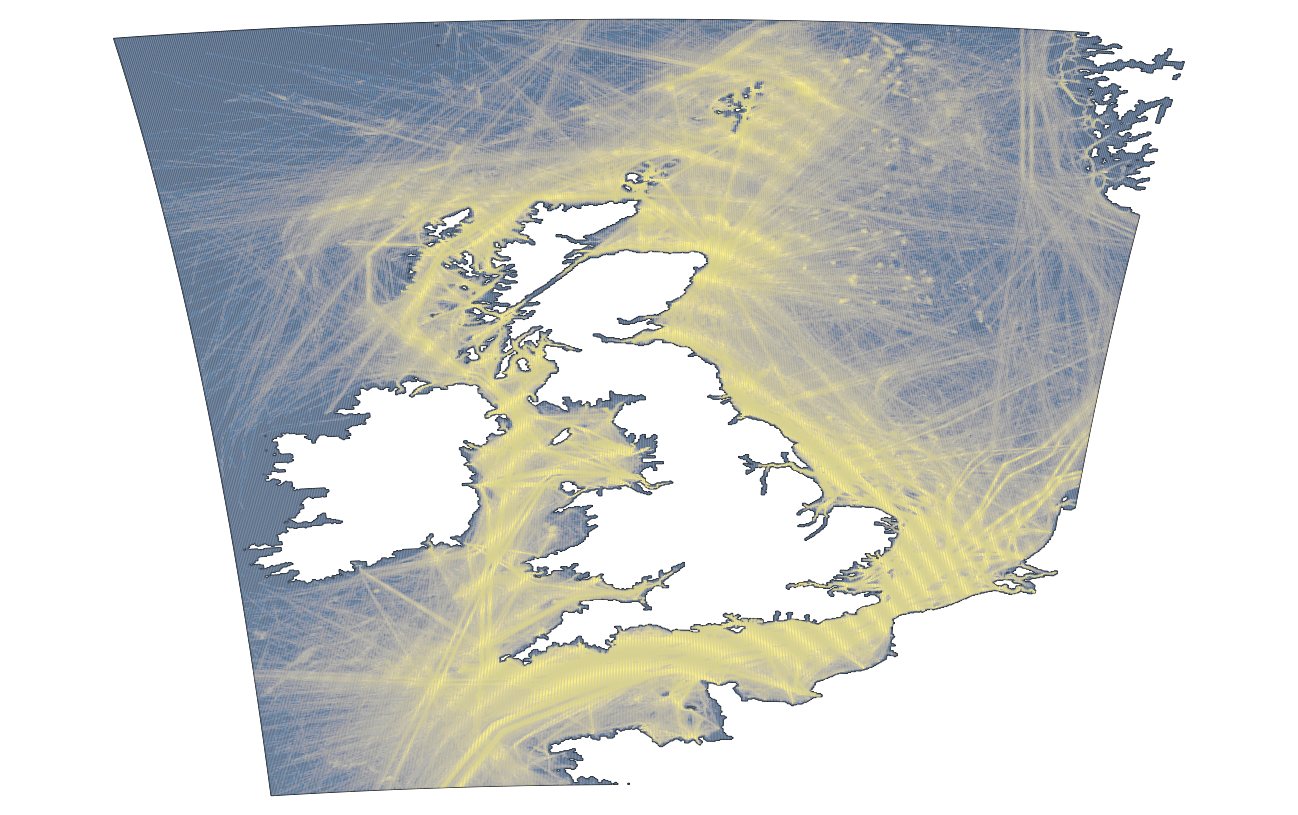
Mapping UK shipping density and routes from AIS (MMO 1066)
As part of this project, the Marine Management Organisation (MMO) developed open source software tools to process AIS data that can be downloaded using following link: MMO1066 AIS tool distribution package.
The tool is available under open government license you do not require permission to develop it for your own needs; however we would be interested to learn of the work you carry out with the tool and any improvements you may make to tool.
This is the context for the data analysis tool developed by this project – indicated as 2 in the following steps.
Raw data The first step in the process is to get raw data. For this project this was AIS shipping transits data – this was positions broadcast by vessels of 300 gross tonnes or more in UK waters, provided by MCA. If you are beginning at this stage, you must get raw data independent of MMO.
Data analysis tool A data analysis tool is then used to process the raw data into a format that is compatible with use in geographic information system (GIS) software. This processing focuses on producing data that can be analysed by categories attributed to it, like type of vessel (in the case of AIS data). This processing has been completed for AIS data in all waters within reception range (approximately 40 nautical miles) of the UK AIS receivers. The 2011 and 2012 AIS data derived density grid products are available through
. Processed data At the end of data analysis by the tool, data compatible with GIS software is produced.
GIS software Data sets can now be fed into GIS software such as ArcGIS.
Spatial information Through GIS software, data can be interrogated, such as by category, to produce spatial representation reflecting attributes defined for the data, like a shipping density map.
Defra Data Services Platform
Defra Data Services Platform (Defra = Department for Environment Food & Rural Affairs)
Marine Management Organisation Datasets
| Shipping vessel density grid 2011 | https://environment.data.gov.uk/DefraDataDownload/?mapService=MMO/ShippingVesselDensityGrid2011&Mode=spatial |
| Shipping vessel density grid 2012 | https://environment.data.gov.uk/DefraDataDownload/?mapService=MMO/ShippingVesselDensityGrid2012&Mode=spatial |
| Shipping Vessel Density Grid 2013 | https://environment.data.gov.uk/DefraDataDownload/?mapService=MMO/ShippingVesselDensityGrid2013&Mode=spatial |
| Shipping Vessel Density Grid 2014 | https://environment.data.gov.uk/DefraDataDownload/?mapService=MMO/ShippingVesselDensityGrid2014&Mode=spatial |
| Shipping Vessel Density Grid 2015 | https://environment.data.gov.uk/DefraDataDownload/?mapService=MMO/ShippingVesselDensityGrid2015&Mode=spatial |
| Shipping Vessel Density Grid 2016 | https://environment.data.gov.uk/DefraDataDownload/?mapService=MMO/ShippingVesselDensityGrid2016&mode=spatial |
| Shipping Vessel Density Grid 2017 | https://environment.data.gov.uk/DefraDataDownload/?mapService=MMO/ShippingVesselDensityGrid2017&mode=spatial |
| Shipping Vessel Density Grid 2018 | https://environment.data.gov.uk/DefraDataDownload/?mapService=MMO/ShippingVesselDensityGrid2018&mode=spatial |
| Shipping Vessel Density Grid 2019 | https://environment.data.gov.uk/DefraDataDownload/?mapService=MMO/ShippingVesselDensityGrid2019&mode=spatial |
data.gov.uk
MMO1066 Anonymised AIS derived track lines 2011
MMO1066 Anonymised AIS derived track lines 2012
Anonymised AIS Derived Track Lines 2013
Anonymised AIS Derived Track Lines 2014
Anonymised AIS Derived Track Lines 2015
Vessel Density Grid
This dataset contains the average weekly shipping density for the whole of the UK at a 2km grid resolution. For 2015, AIS datasets were sampled from the first seven days of each month, commencing with January,at monthly intervals. The total value for all 12 weeks was divided by 12 to determine the weekly average, therefore decimal values may occur for certain cells. The weekly average was also multiplied by 52 to provide the estimated annual average.
Ship type groups (STG): 0 - Unknown Vessels 1 - Non-Port service craft 2 - Port service craft 3 - Vessels engaged in dredging or underwater operations 4 - High Speed Craft 5 - Military or Law enforcement 6 - Passenger 7 - Cargo 8 - Tankers 9 - Fishing vessels 10 - Recreational vessels
The field headings in the attribute table are as follows:
- CELLID - ID of grid cell
- AvgSTG0 - Weekly average number of transits of Unknown Vessels
- AvgSTG1 - Weekly average number of transits of Non-Port service craft Avg
- STG2 - Weekly average number of transits of Port service craft
- AvgSTG3 - Weekly average number of transits of Vessels engaged in dredging or underwater operations
- AvgSTG4 - Weekly average number of transits of High Speed Craft
- AvgSTG5 - Weekly average number of transits of Military or Law enforcement vessels
- AvgSTG6 - Weekly average number of transits of Passenger vessels
- AvgSTG7 - Weekly average number of transits of Cargo vessels
- AvgSTG8 - Weekly average number of transits of Tankers
- AvgSTG9 - Weekly average number of transits of Fishing vessels
- AvgSTG10 - Weekly average number of transits of Recreational vessels
- AvgTotalSTG - Weekly average number of all vessel transits
- WeeklyAvgSTGTotal - Weekly average number of all vessel transits
- YearlyAvgSTG_Total - Estimated annual density of all vessel transits
QGIS
MMO_ShippingVesselDensityGrid2019_SHP_Full.zip
MMO_ShippingVesselDensityGrid2018_SHP_Full.zip
Anonymised_AIS_Derived_Track_Lines_2015_MMO.shp