CSIRO Vessel Traffic Density from AIS Data
Vessel Traffic Density from AIS Data (2013-2015)
Vessel Traffic Density from AIS Data (2013-2015) | CSIRO
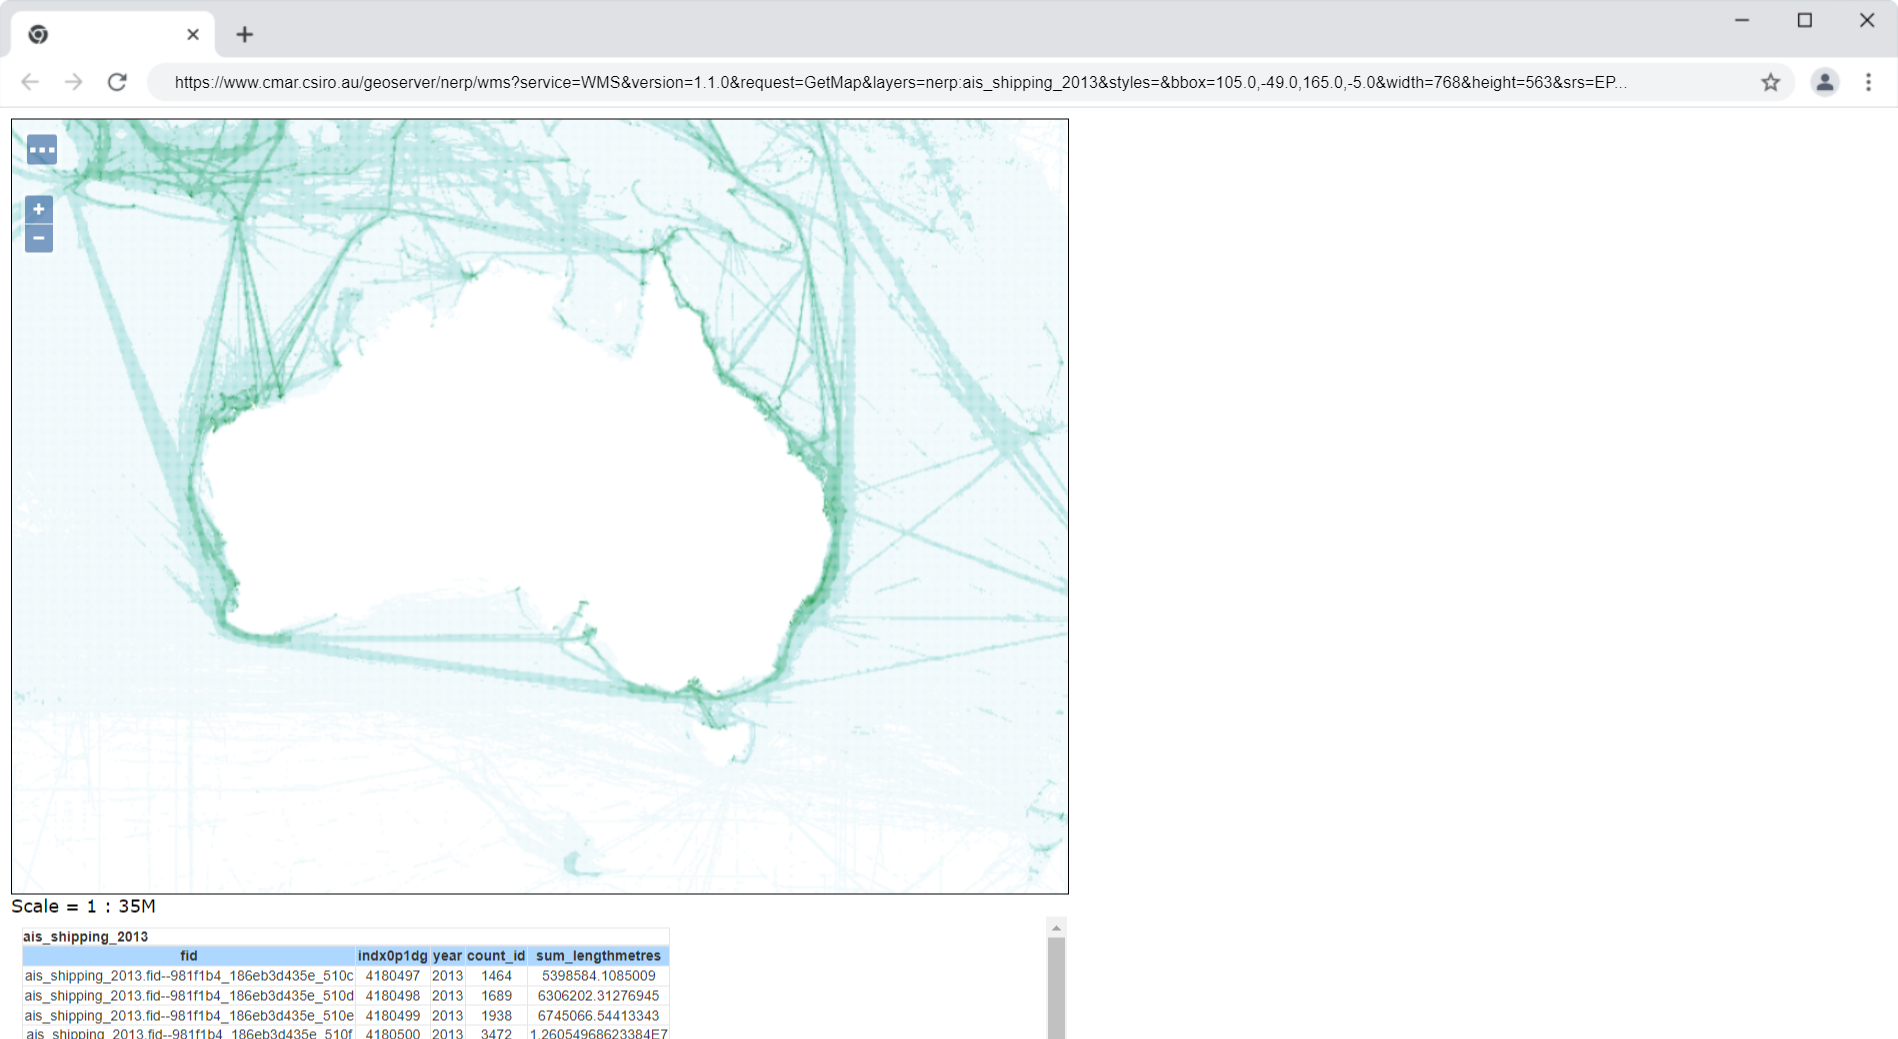
Maps of vessel density 2013-2015 for AIS-equipped vessels, in terms of km traversed in each cell for range of vessel classes for the Australian EZ. AIS data was sourced from AMSA and subsequently processed. The density was calculated for subsets of vessels based on various characteristics such as size or vessel use/purpose. These characteristics were derived and may contain errors. See Peel et. al. (2018) for detail on the processing methods. References Australian Maritime Safety Authority (AMSA) – Custom data extraction of AIS data 2013-2015. https://www.operations.amsa.gov.au/Spatial/DataServices/DigitalData Peel, D., Smith, J.N., Erbe, C., Patterson, T., and Childerhouse, S. (2018). Quantification of risk from shipping to large marine fauna across Australia. Report to the National Environmental Science Programme, Marine Biodiversity Hub. CSIRO. 211pp. Note that this dataset was collected as part of the following project: NESP MB PROJECT C5 – QUANTIFICATION OF RISK FROM SHIPPING TO LARGE MARINE FAUNA ACROSS AUSTRALIA https://catalogue.aodn.org.au/geonetwork/srv/eng/metadata.show?uuid=5fb8766b-b3cb-4fd0-aad7-7dfcda6582a9
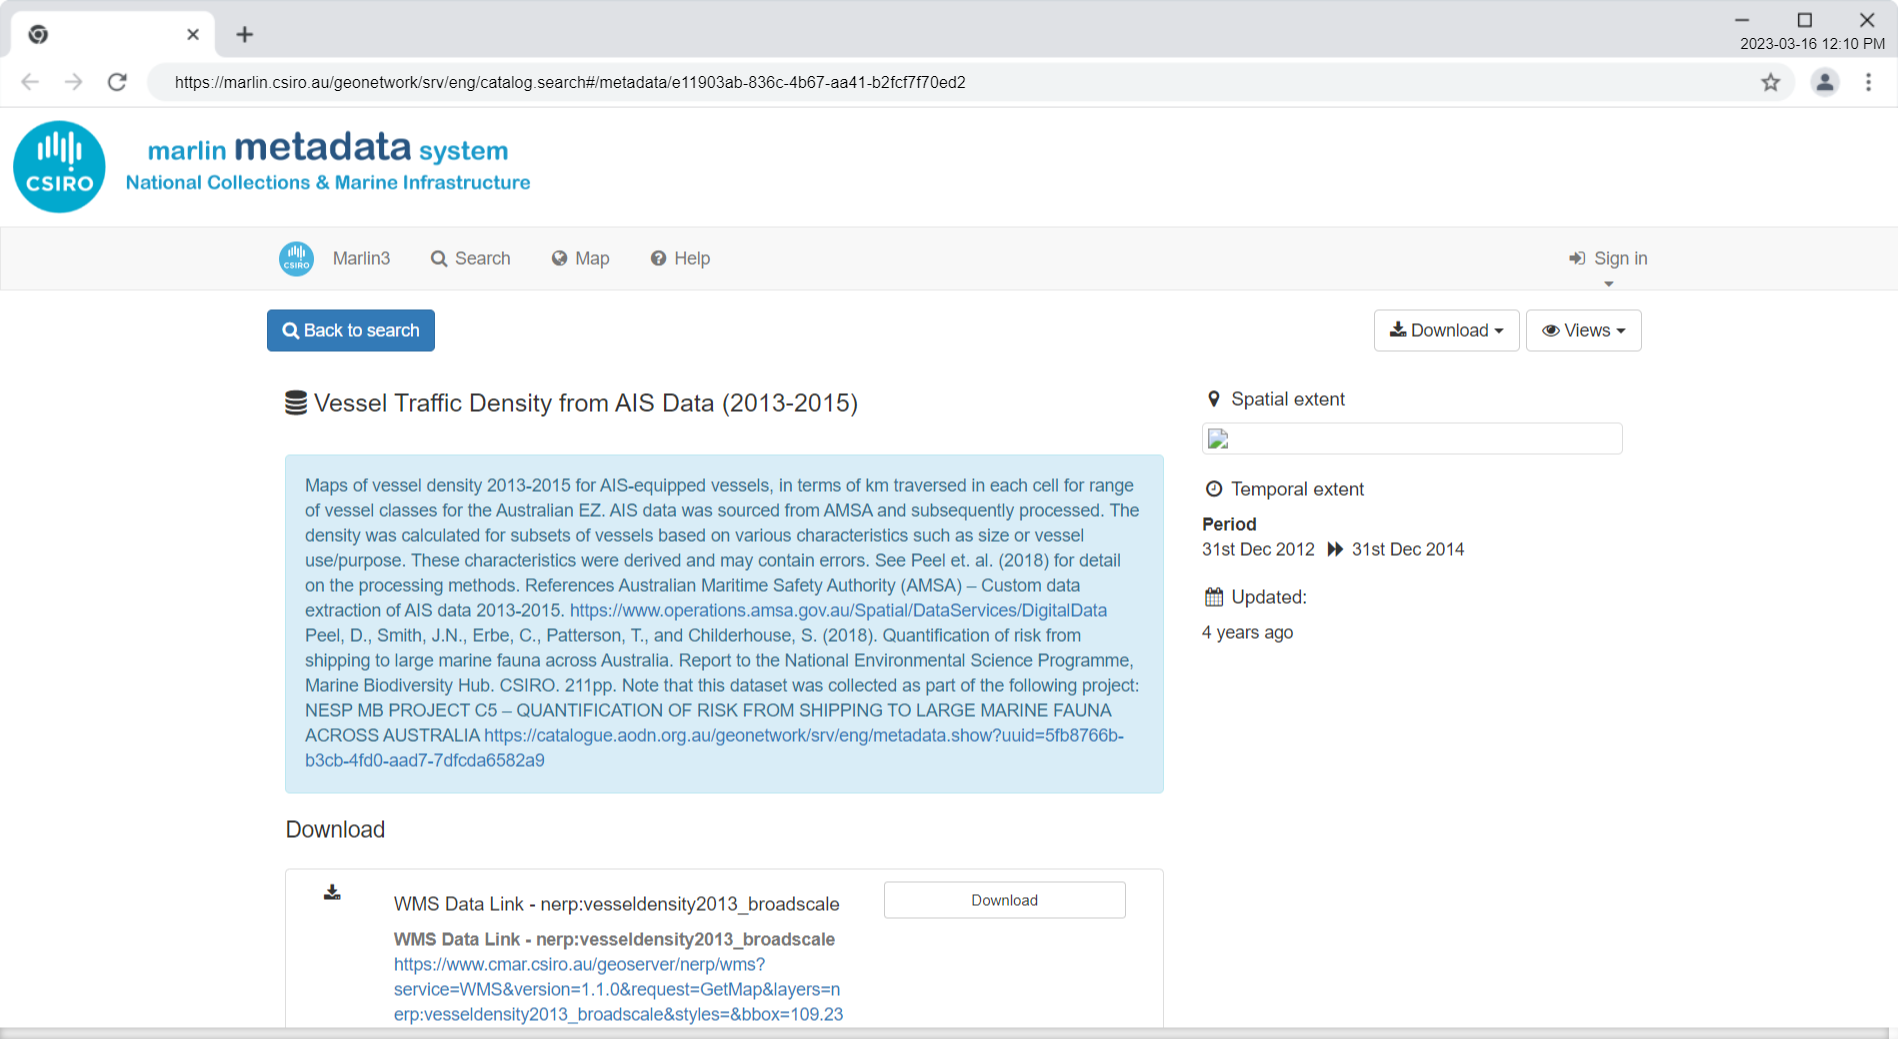
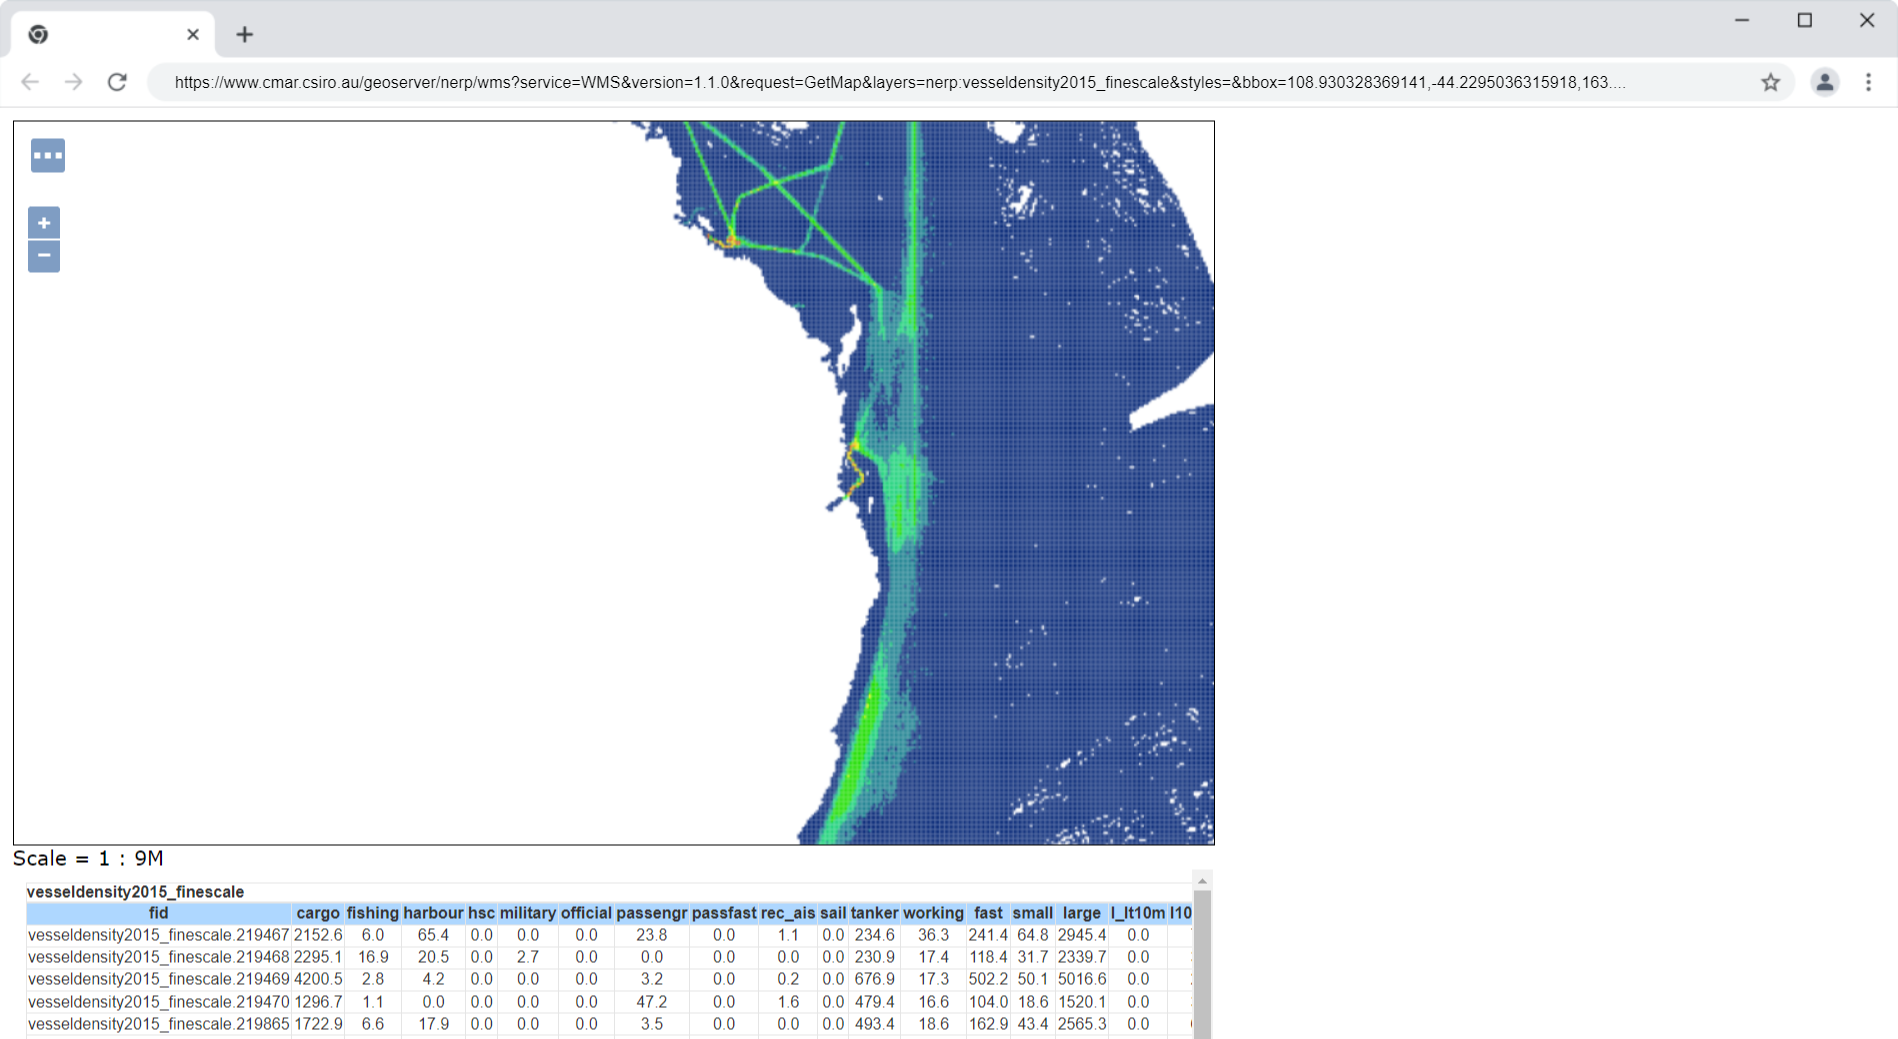
WMS Data Link - nerp:vesseldensity2015_finescale
Australian Ship Reporting System and Automatic Identification System - Shipping Summaries - 1999-2015
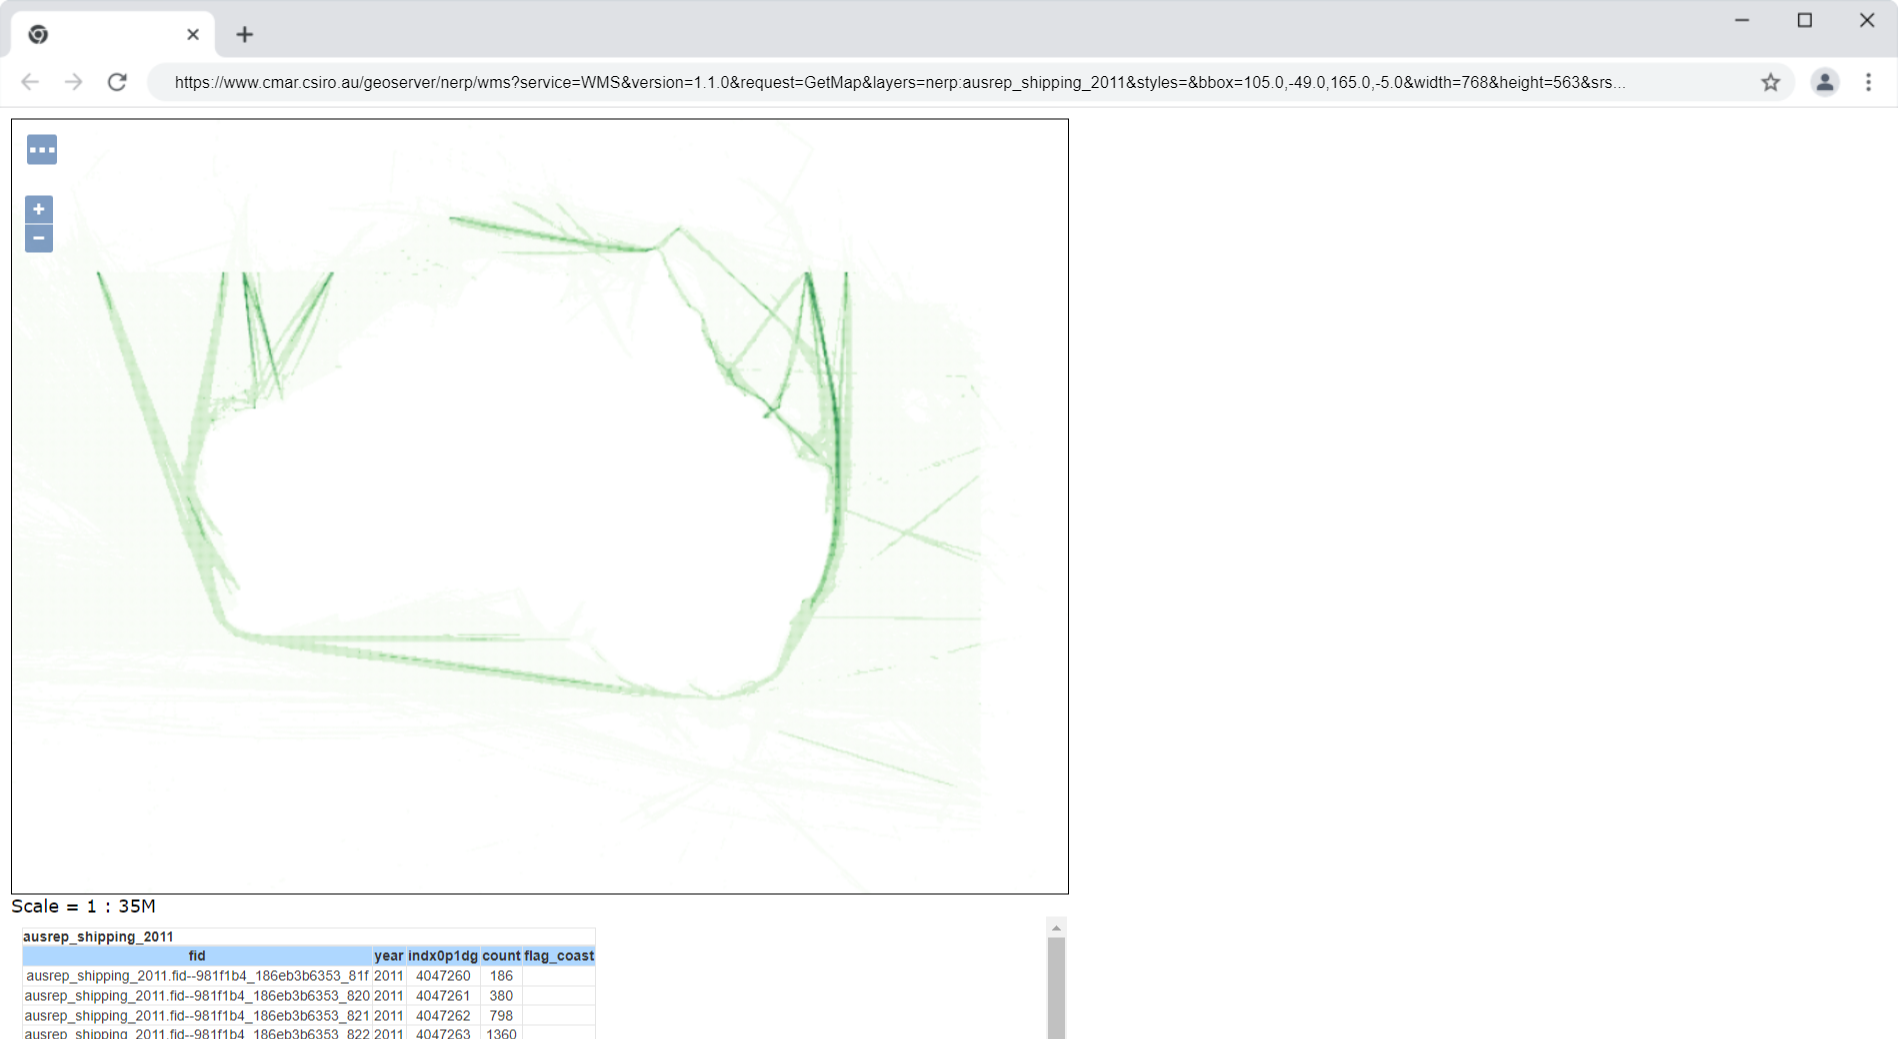
DATA ACCESS - Shipping Summary 2011 WMS
DATA ACCESS - Shipping Summary 2013 WMS
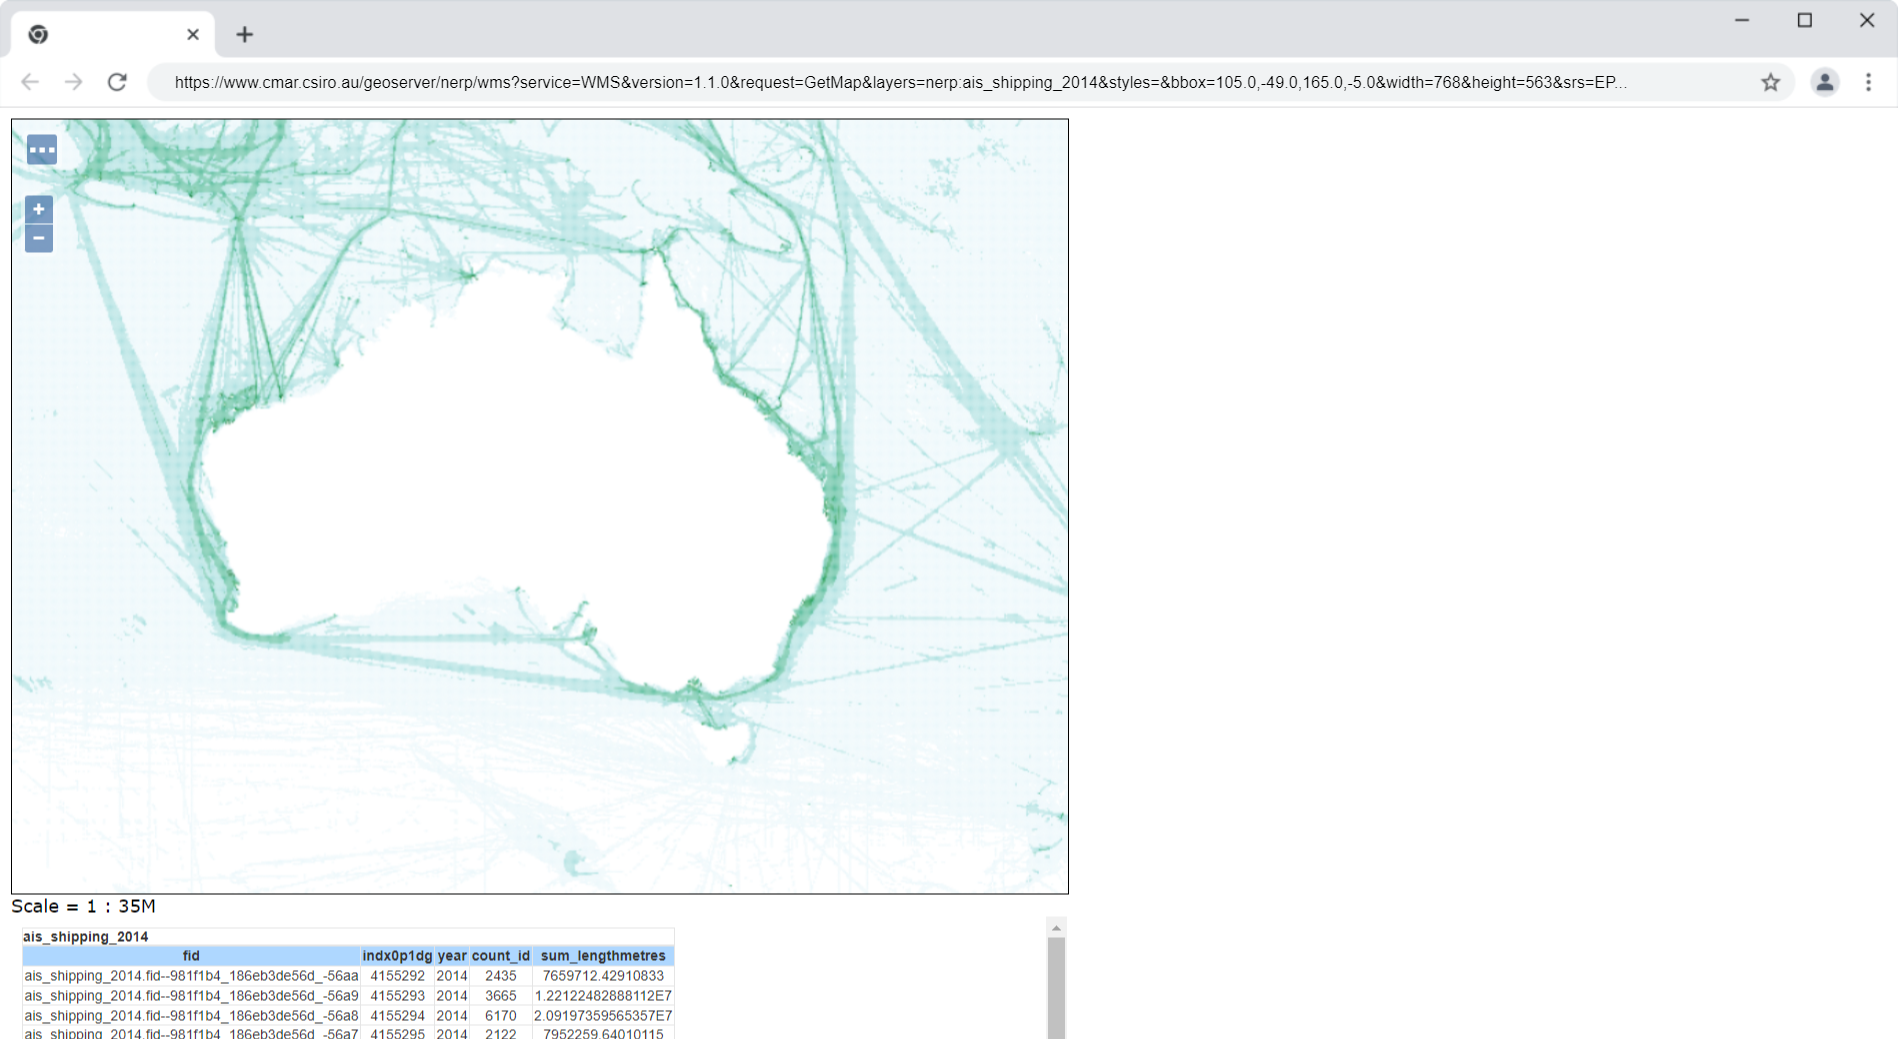
DATA ACCESS - Shipping Summary 2014 WMS