Diophantine approximation sum plots
import math
import matplotlib.pyplot as plt
def int_dist(x):
return abs(x - round(x))
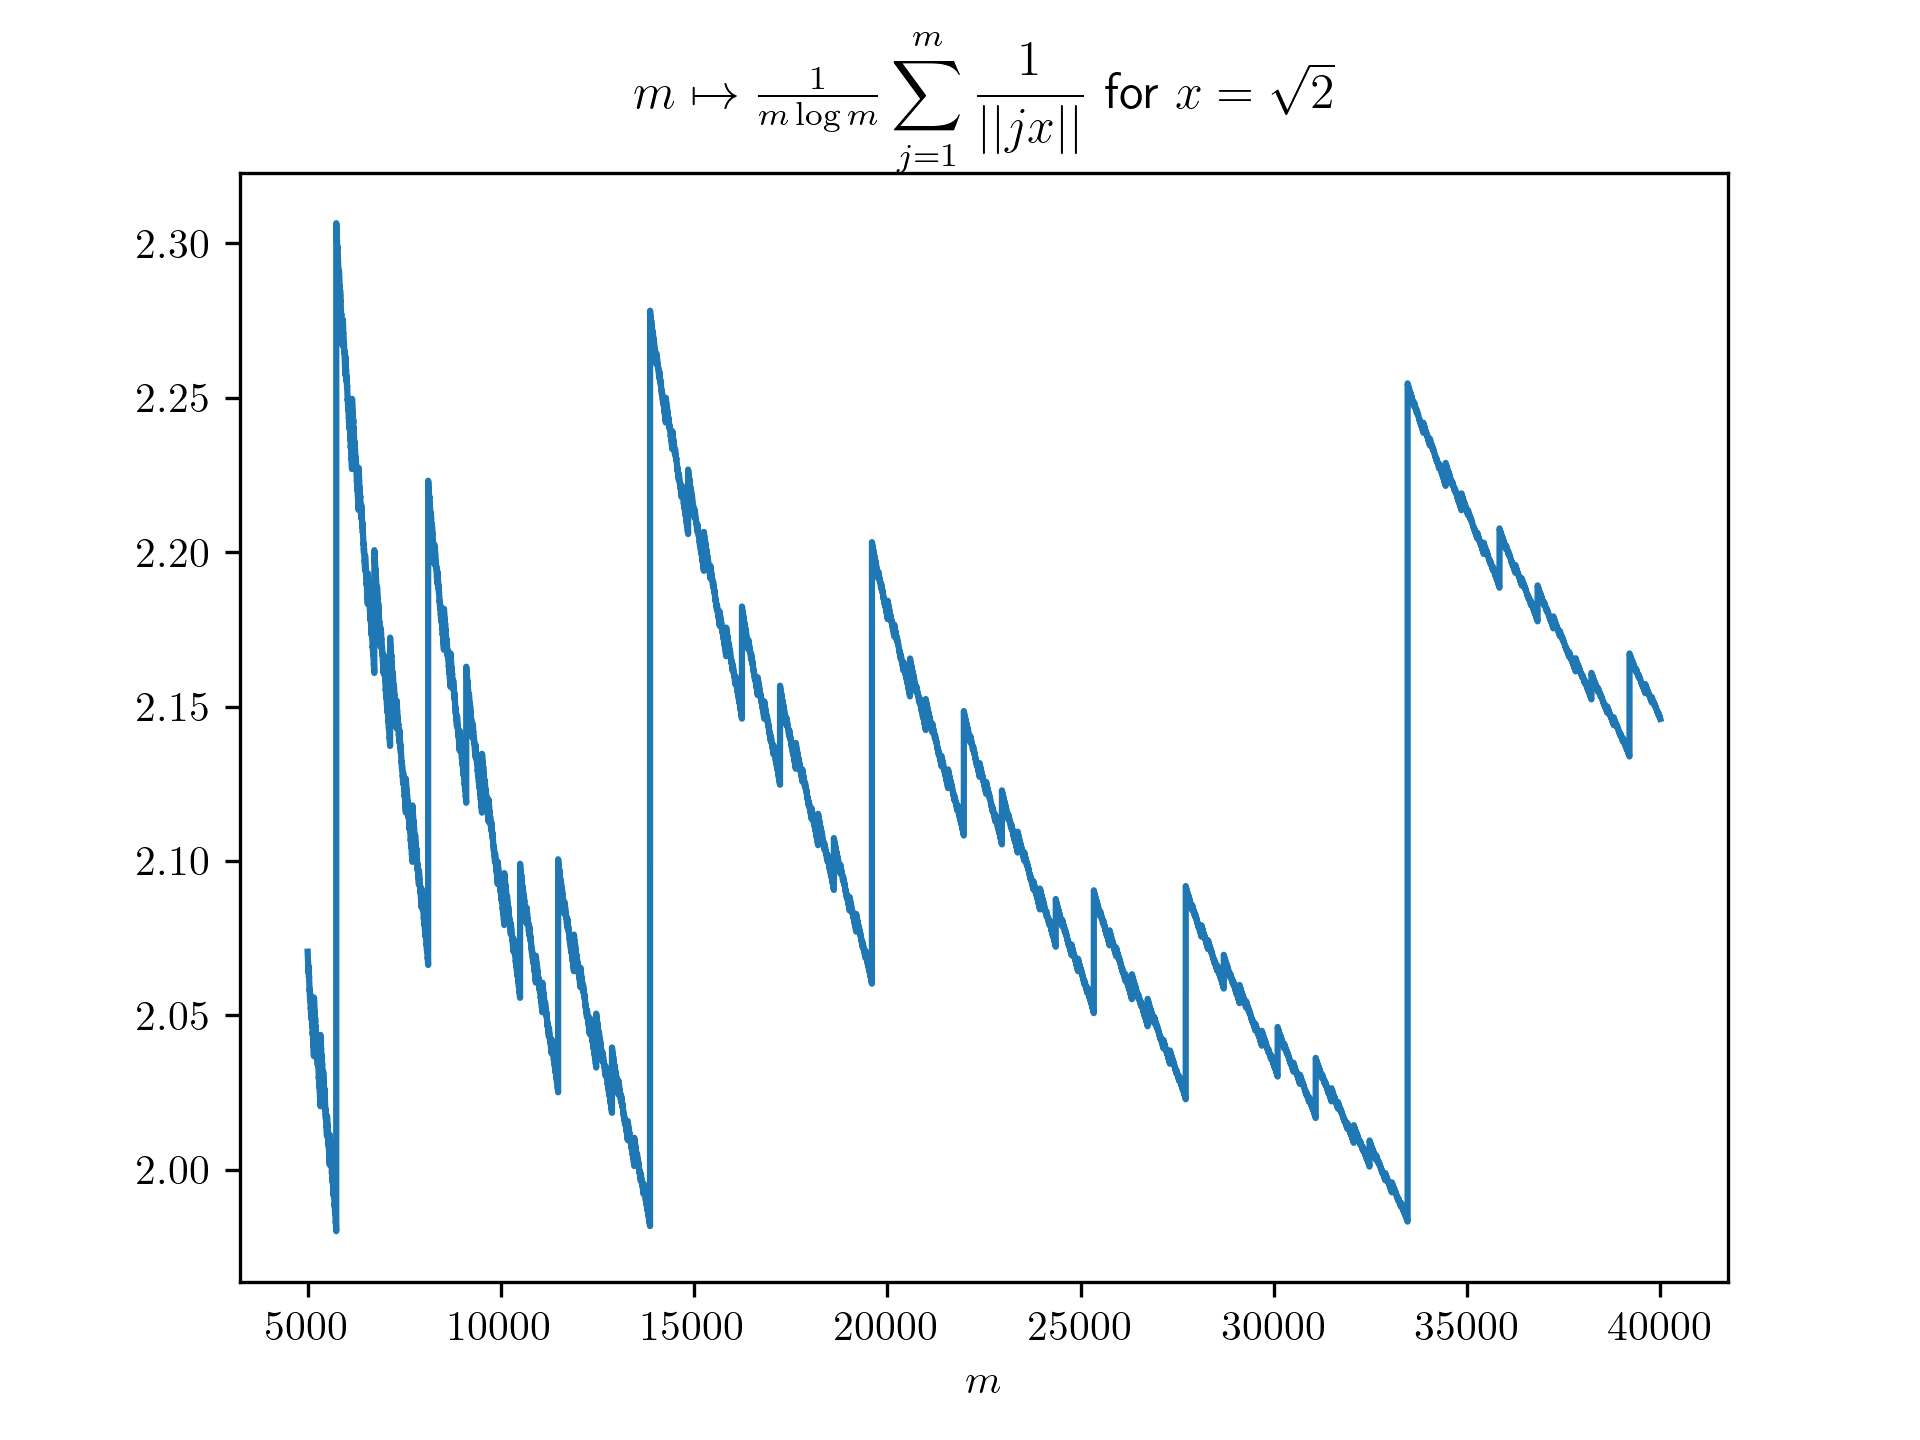
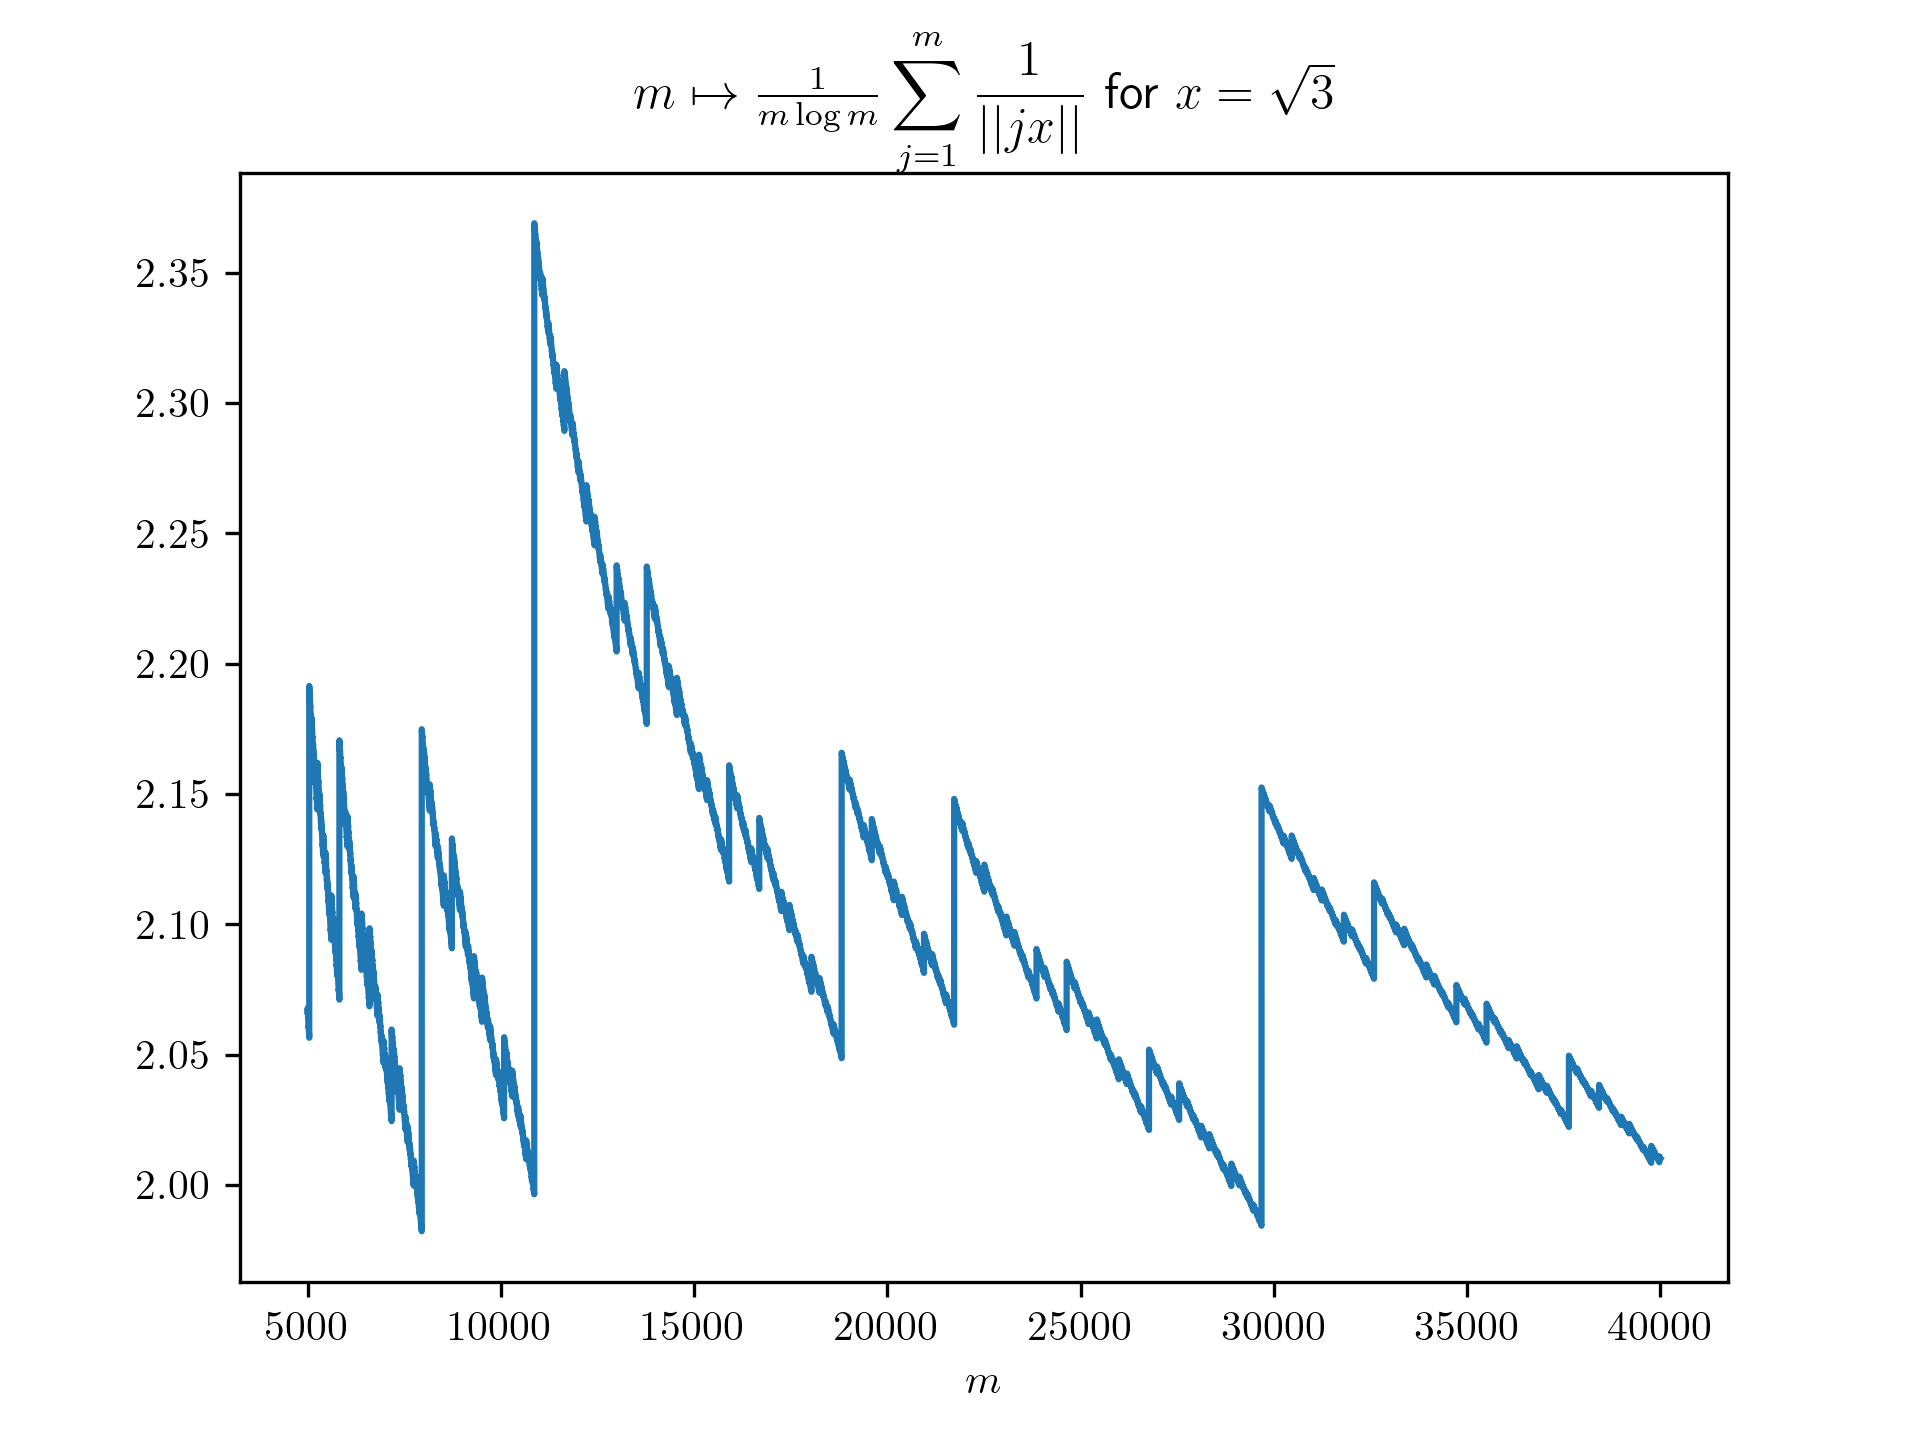
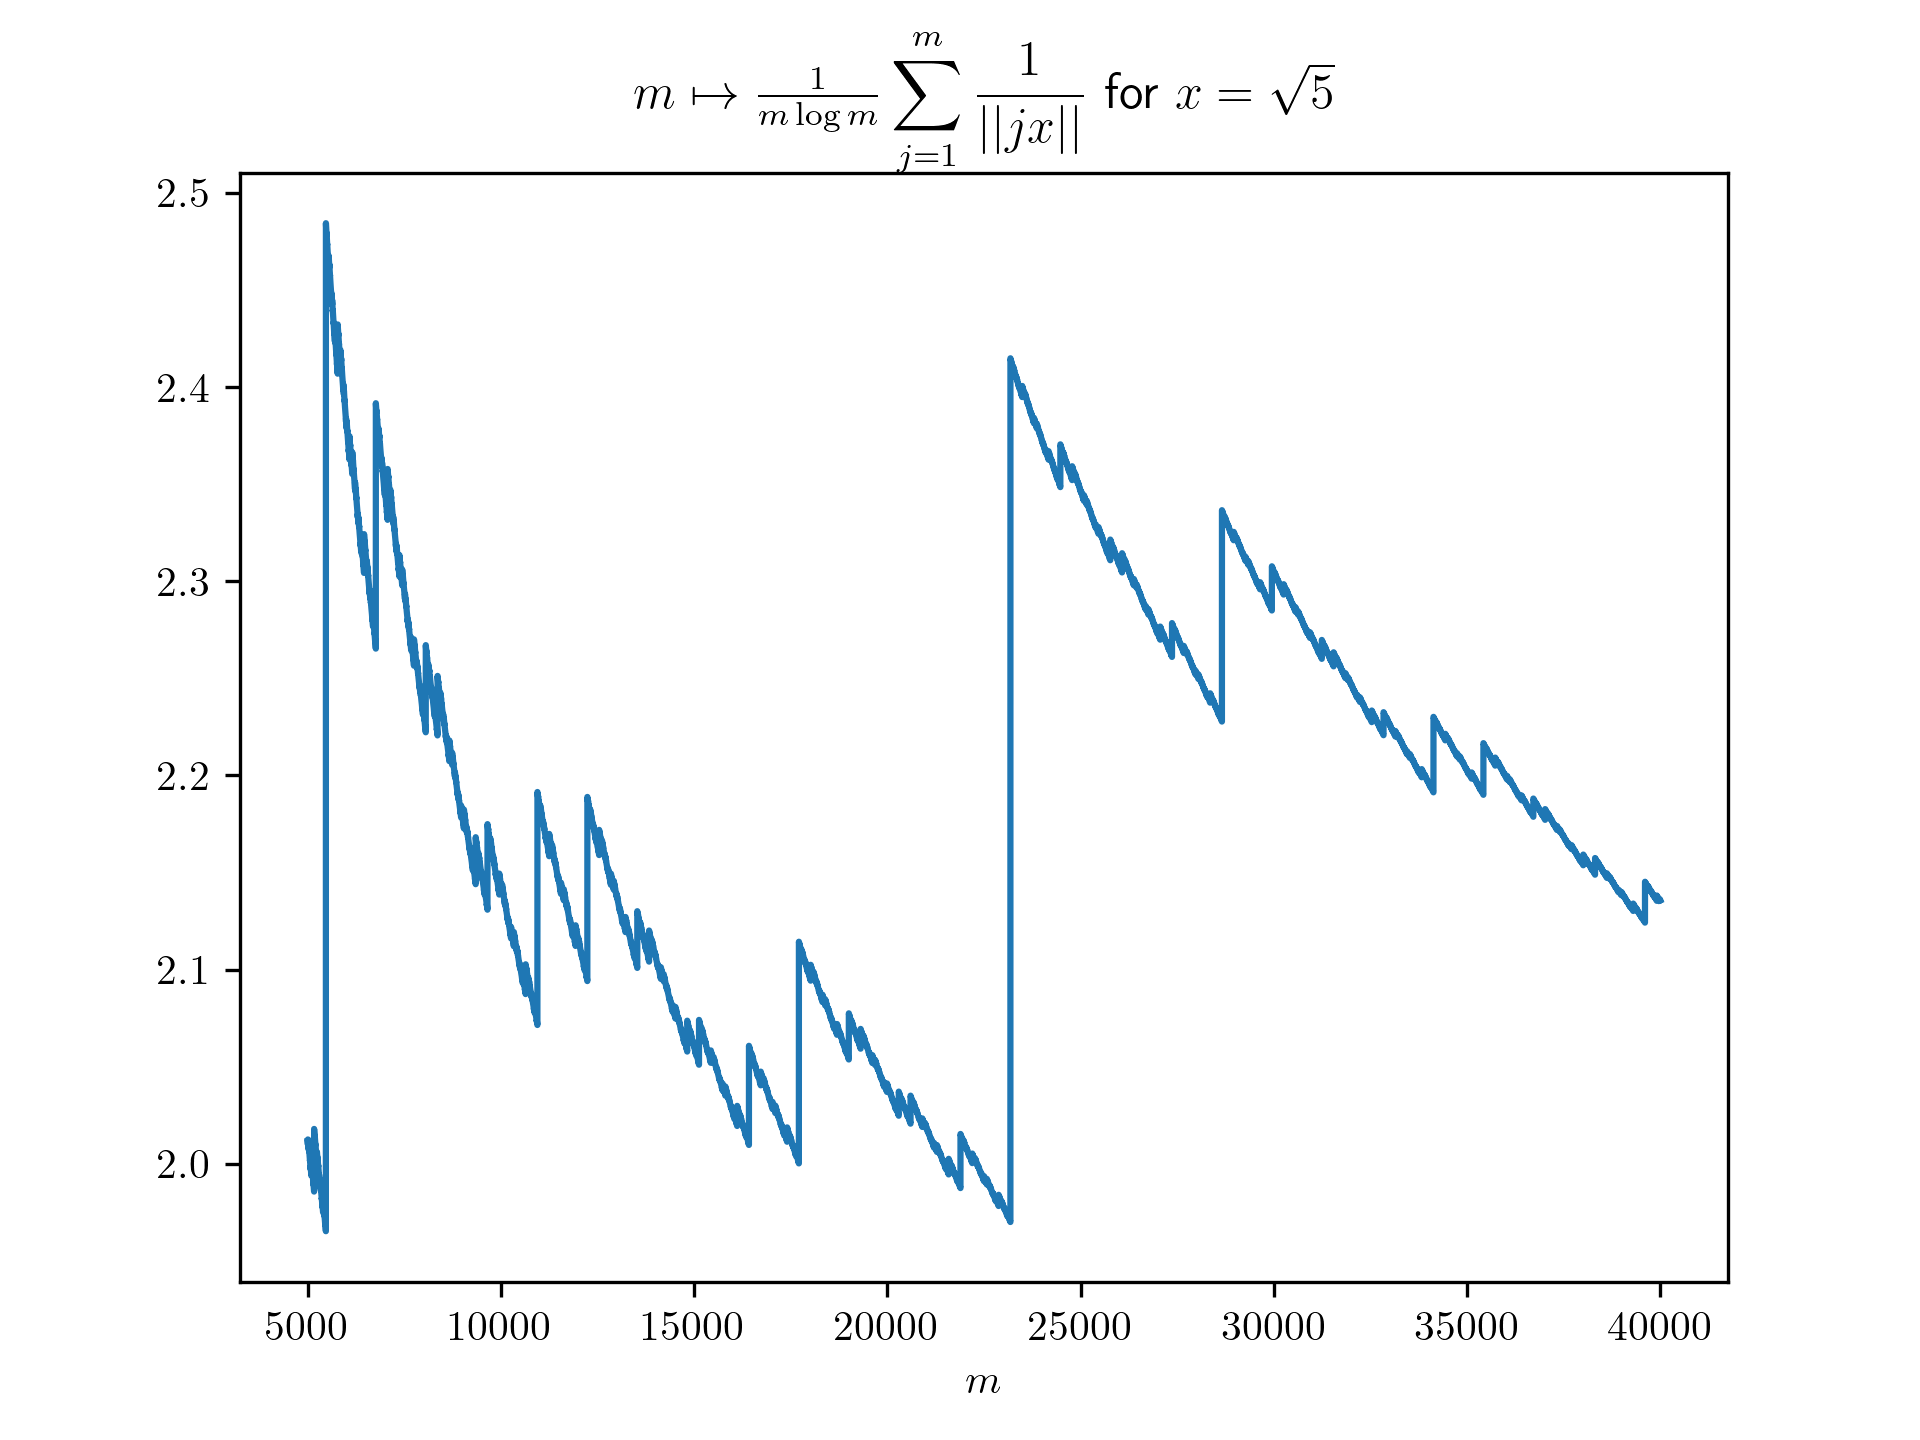
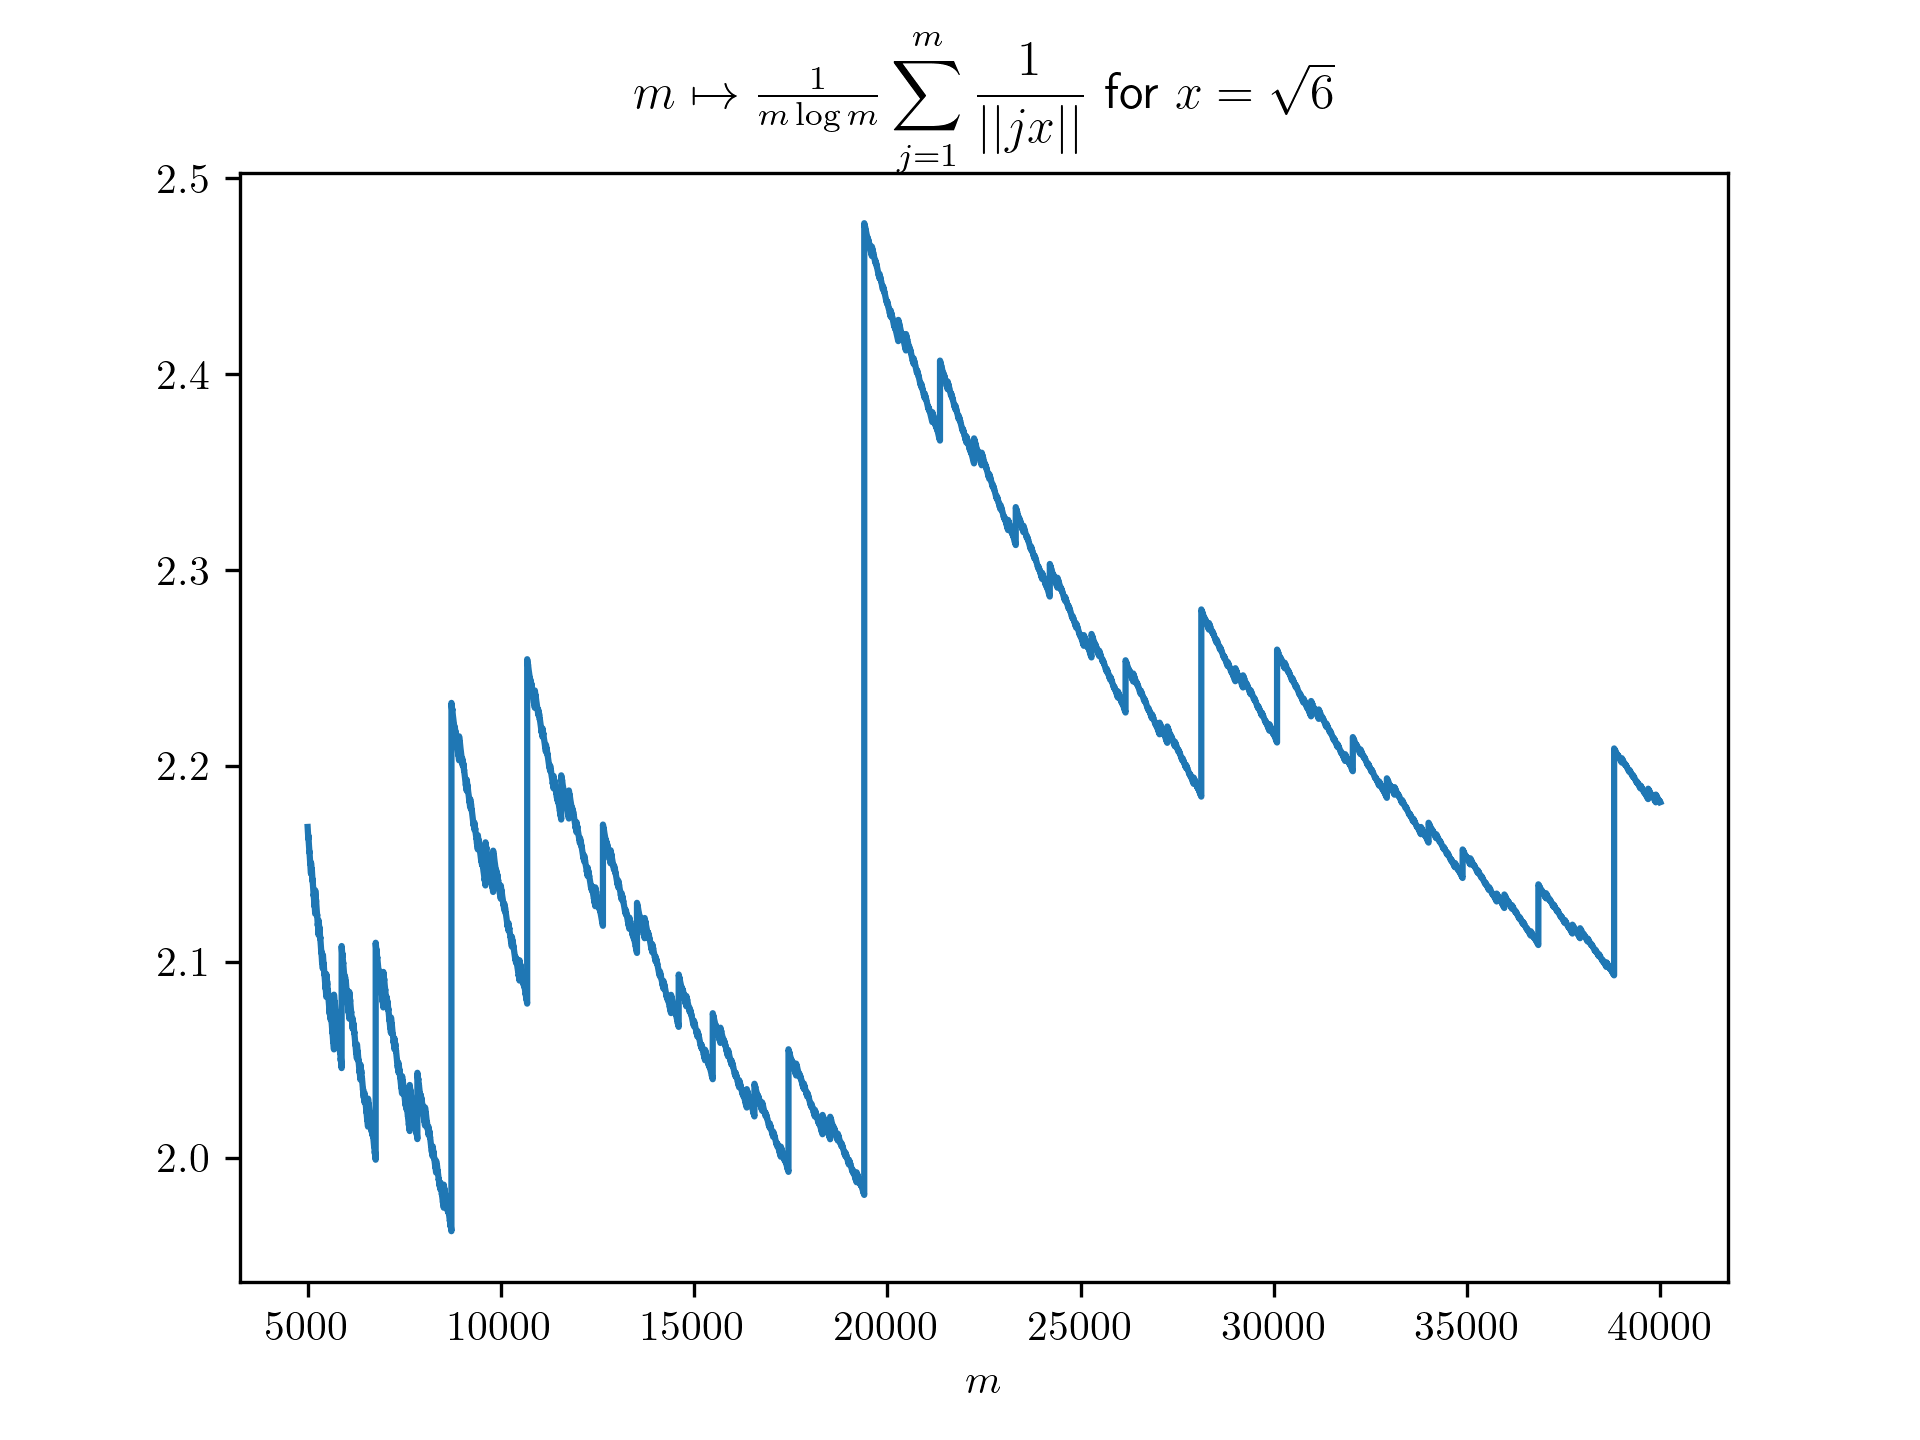
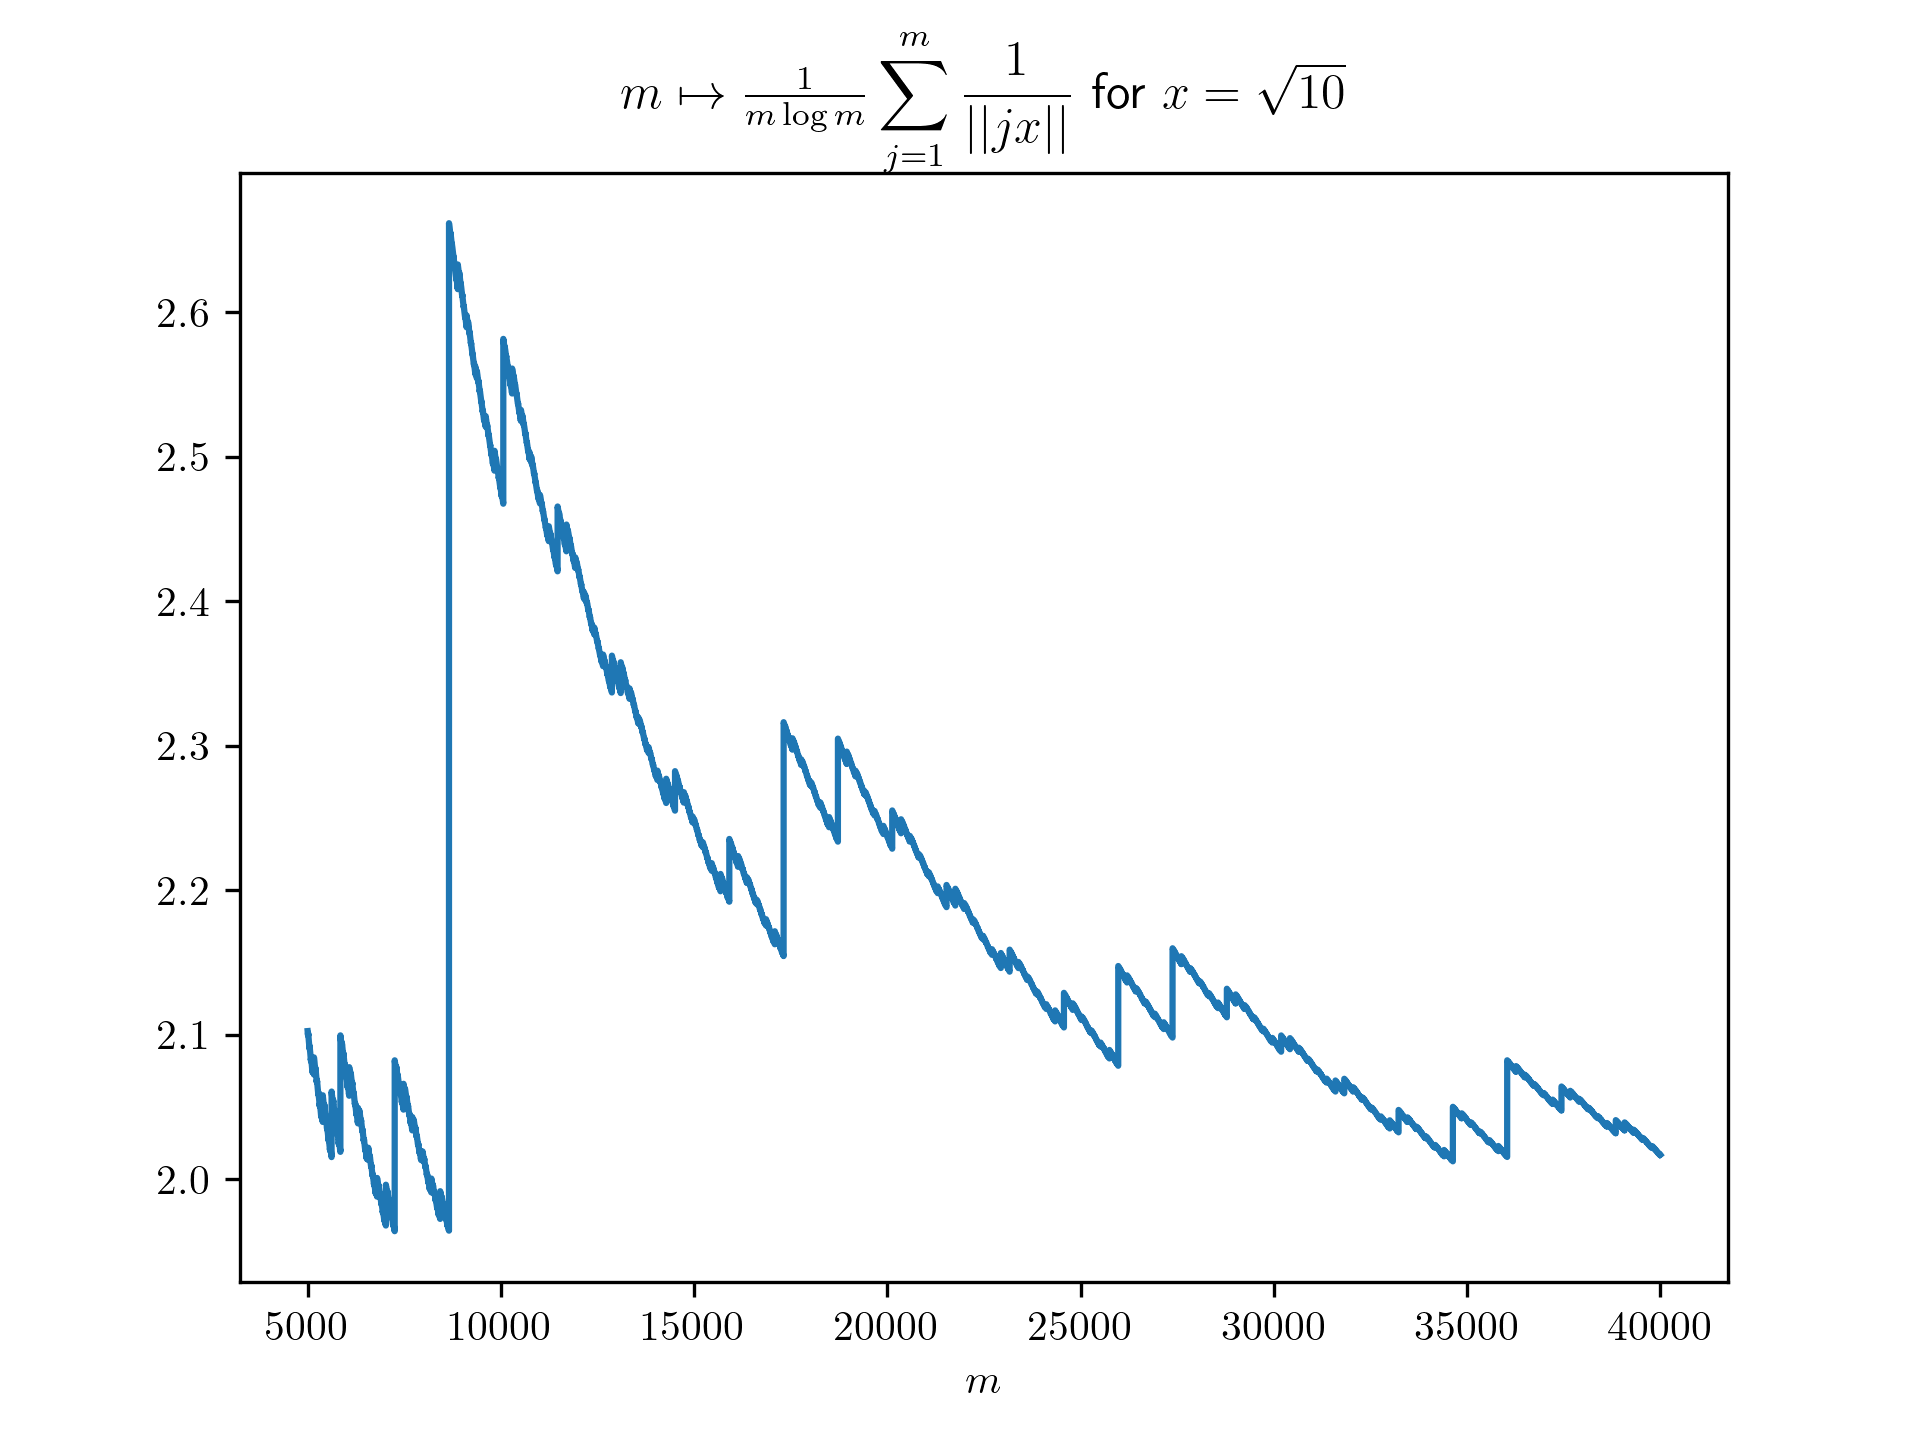
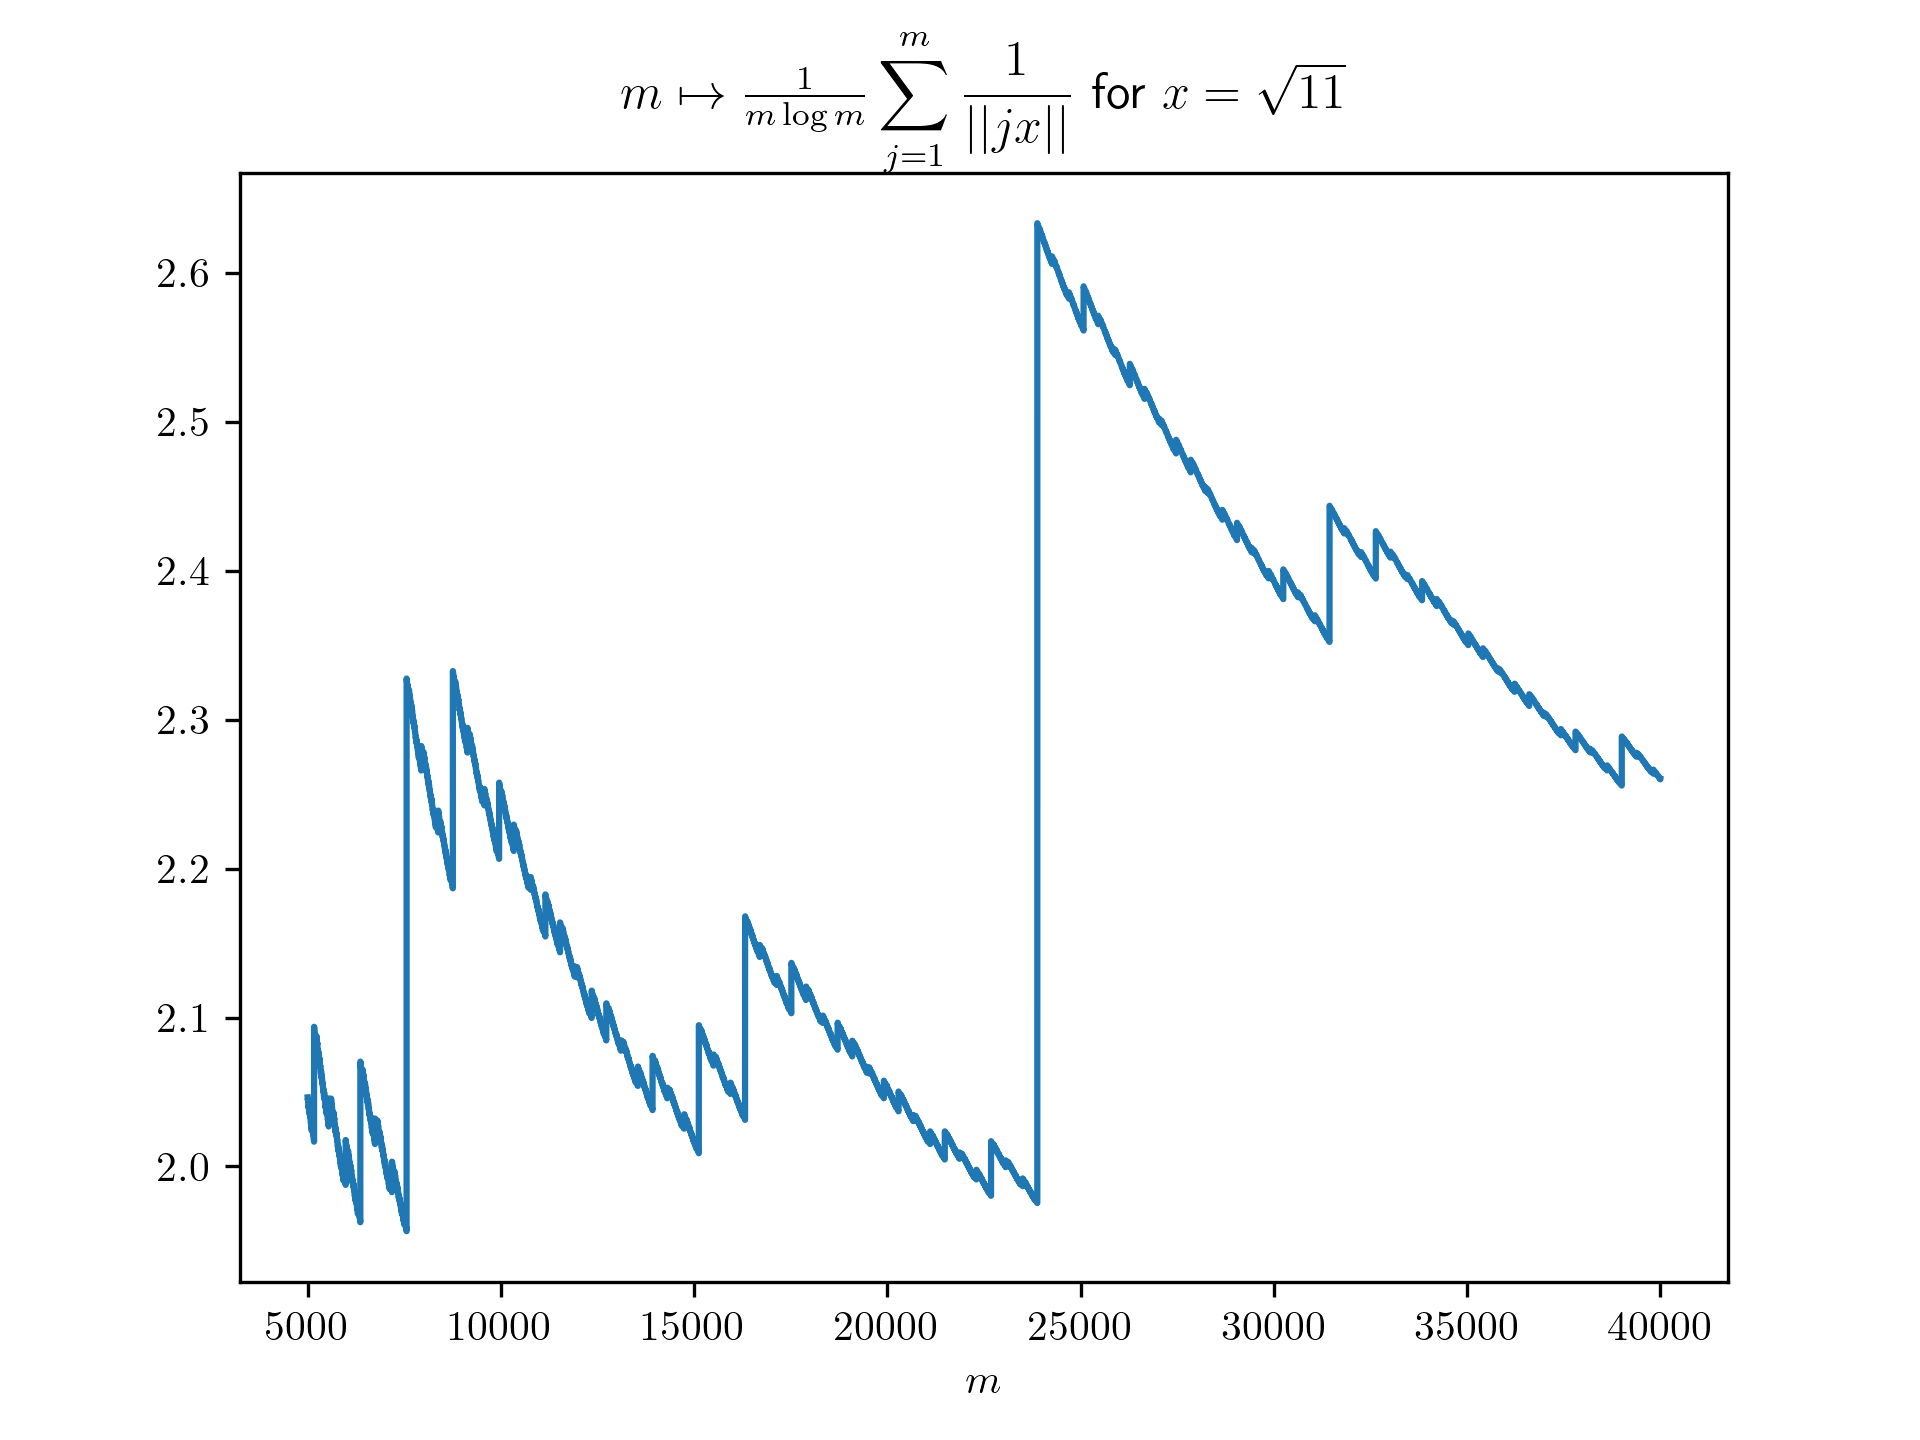
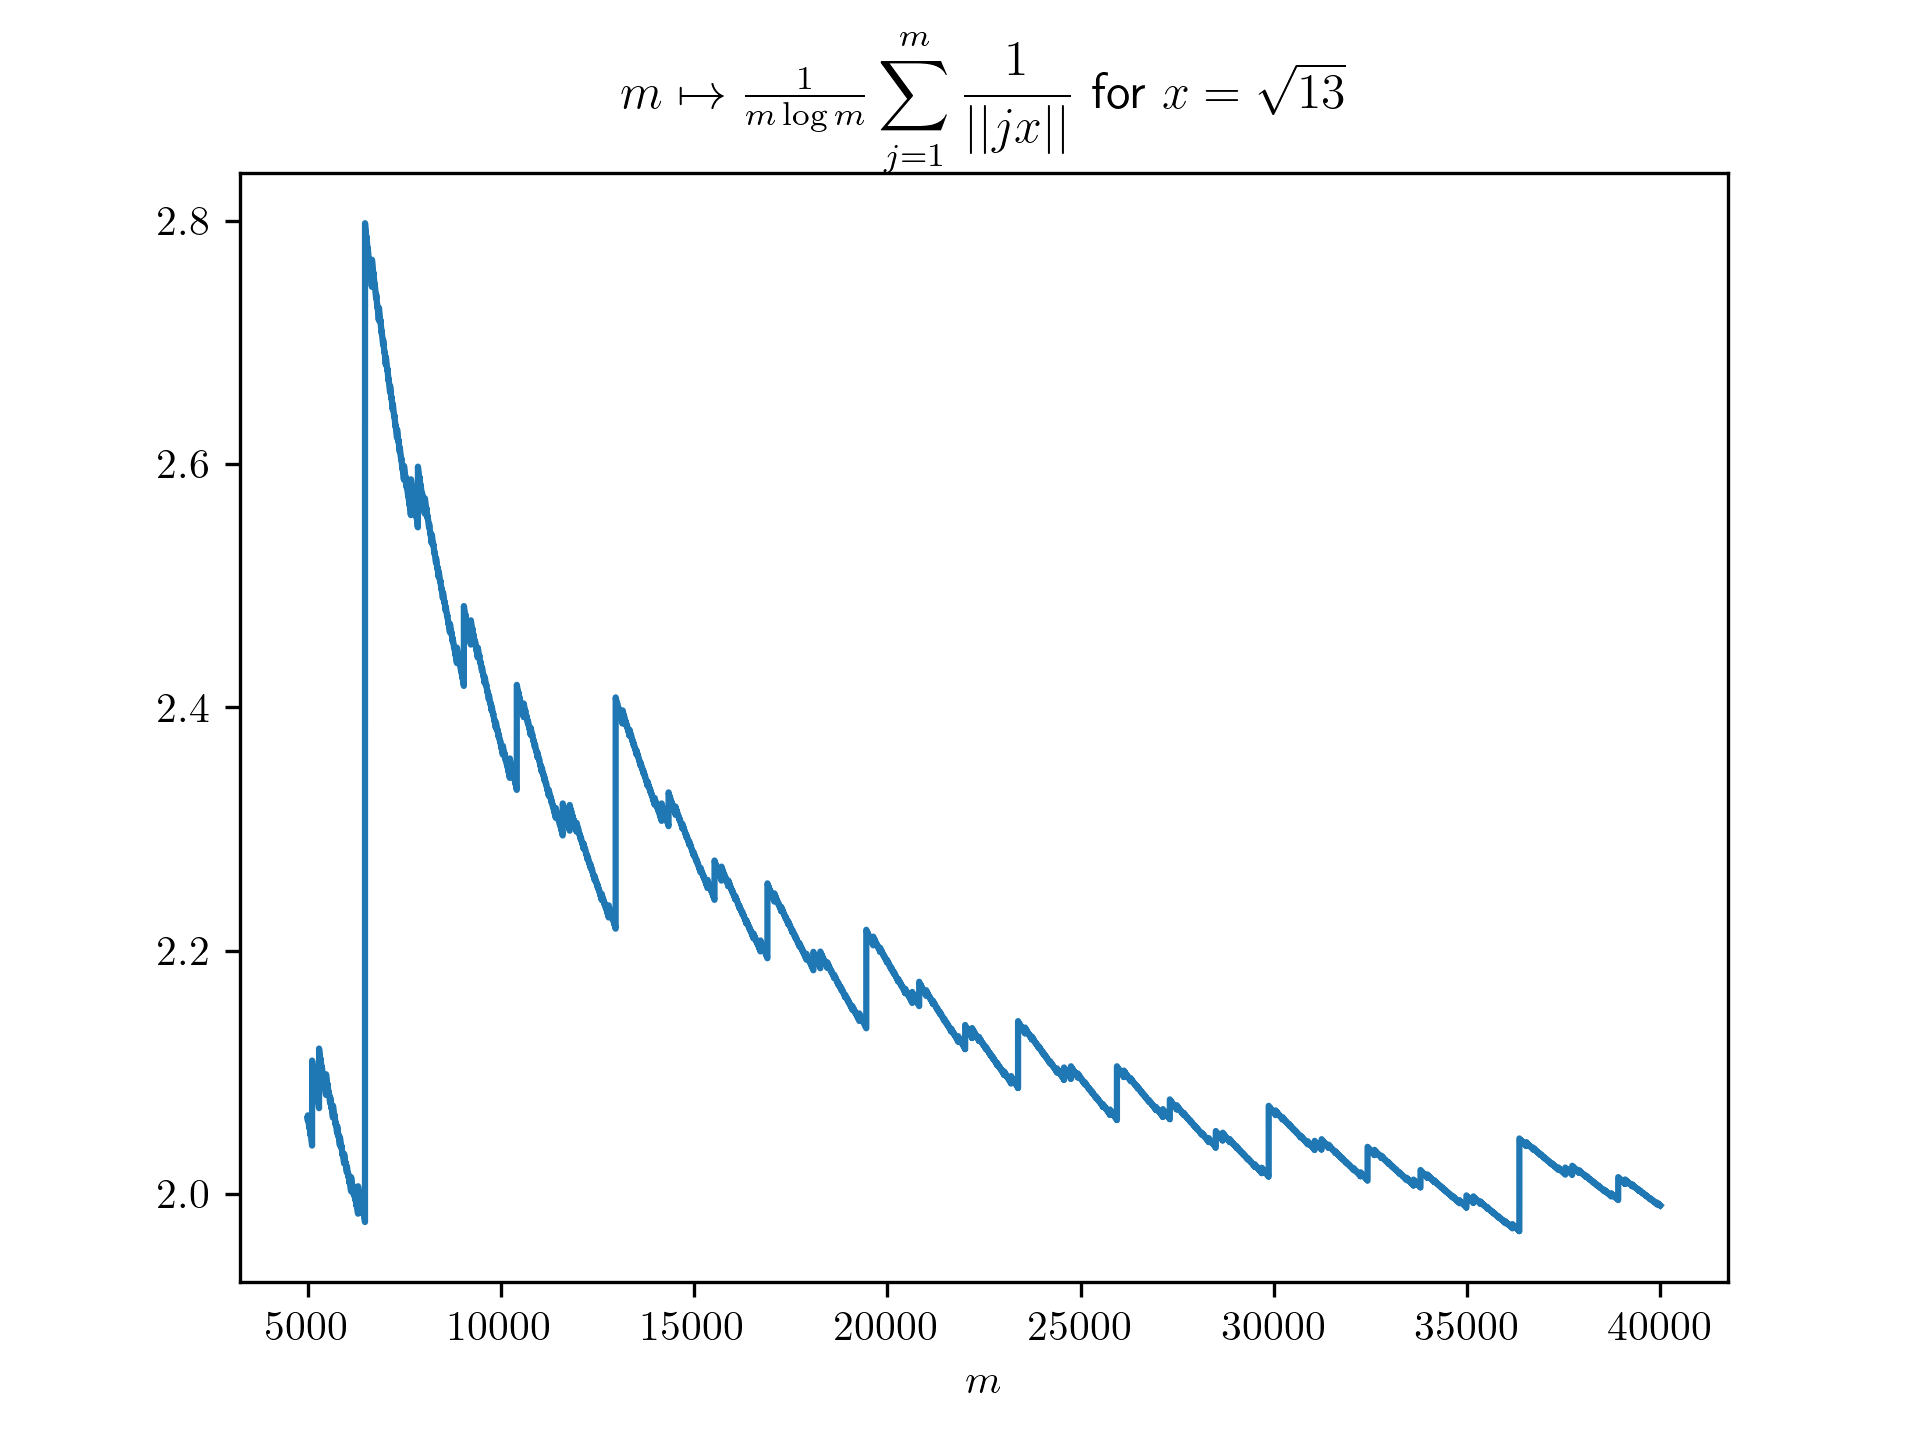
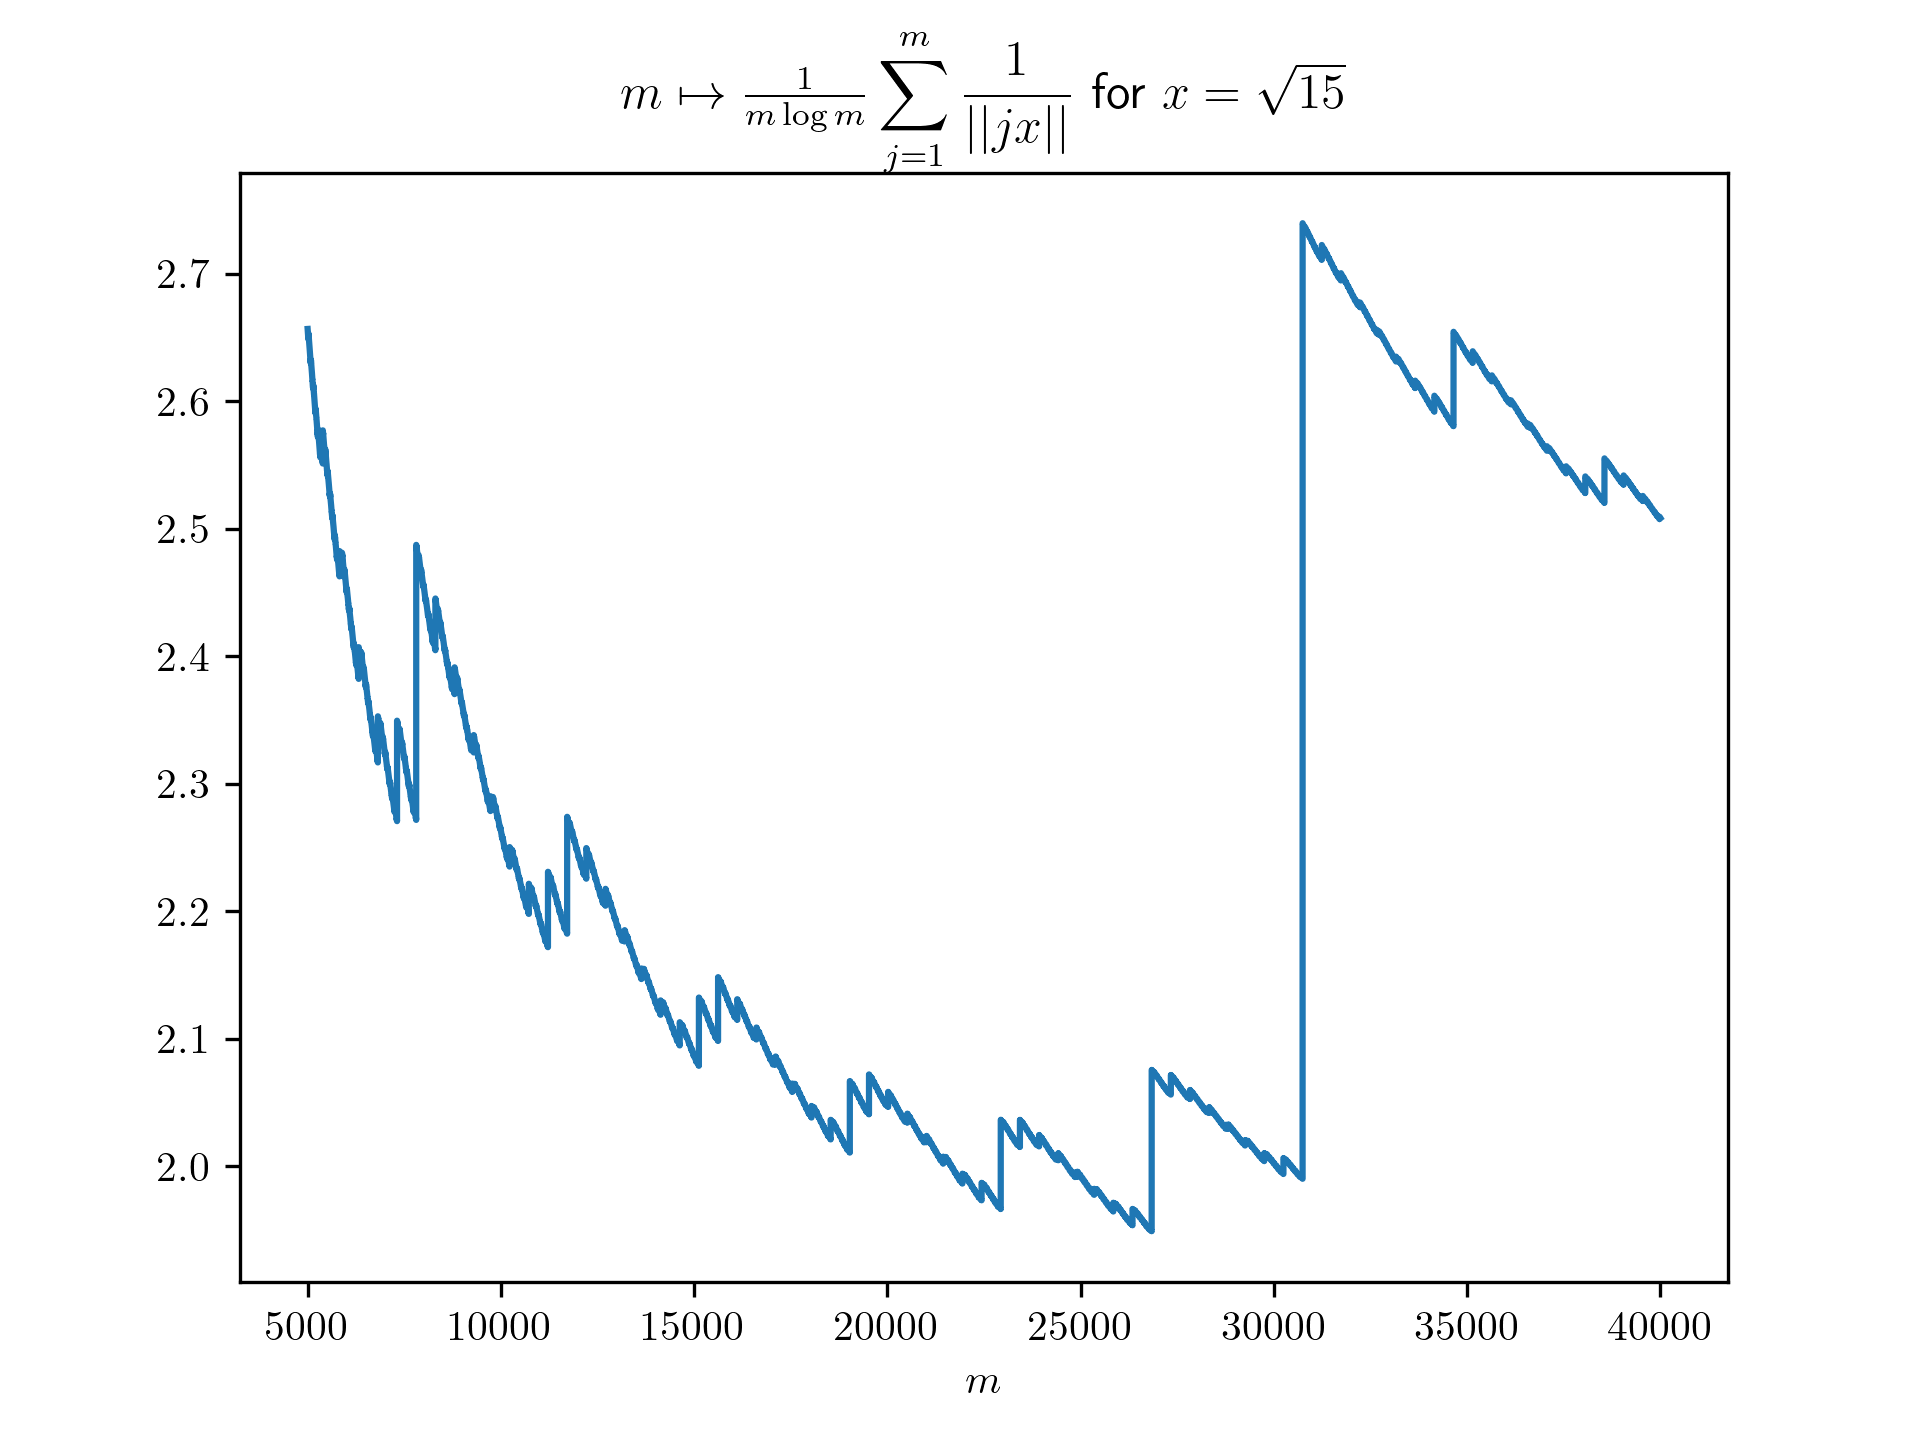
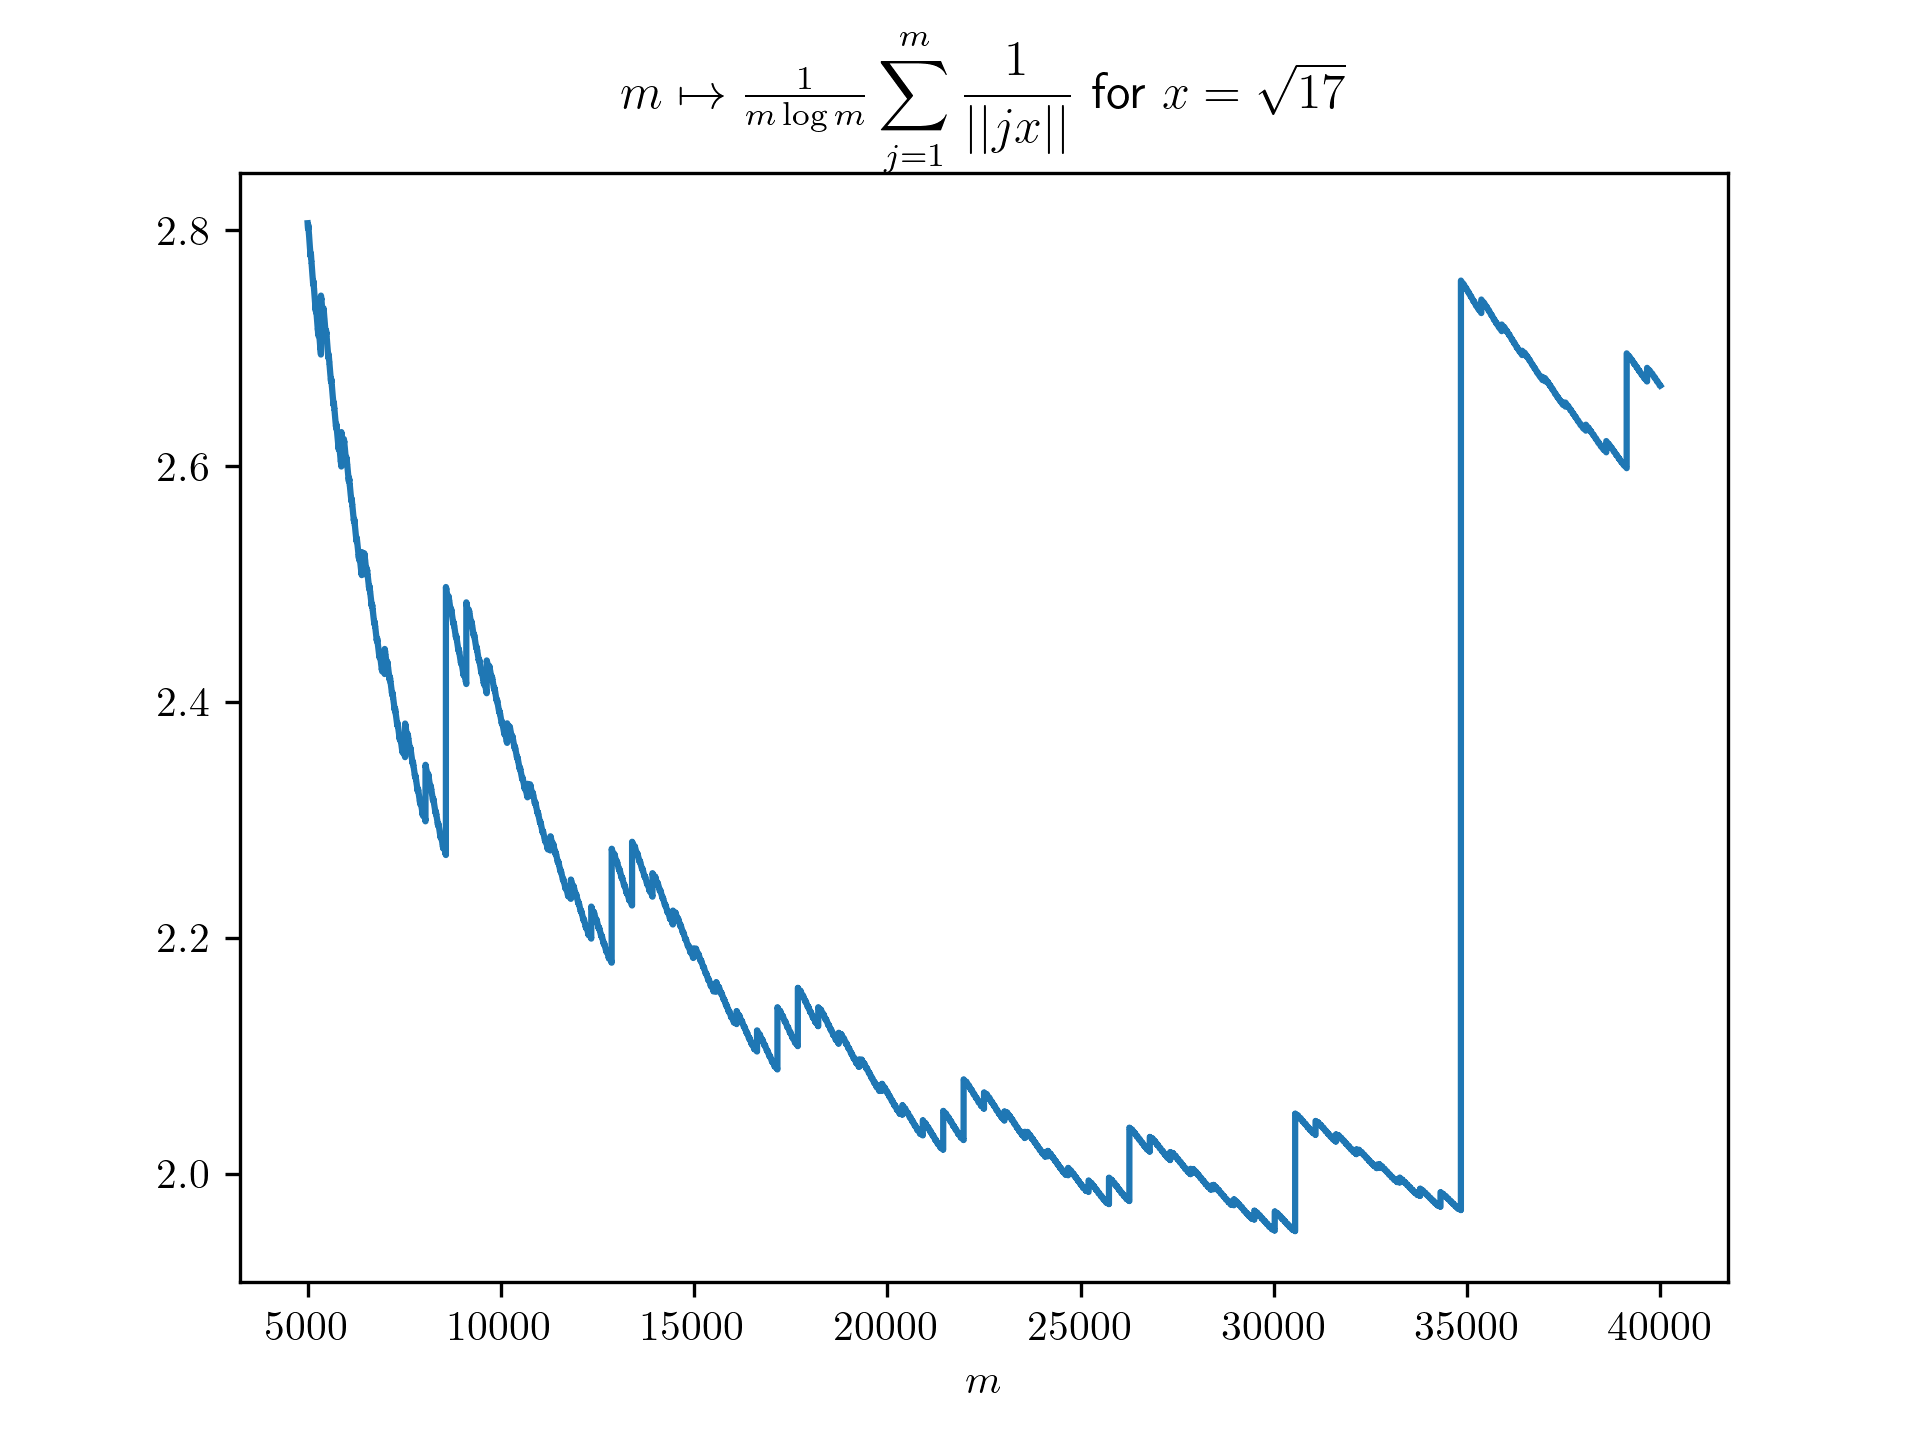
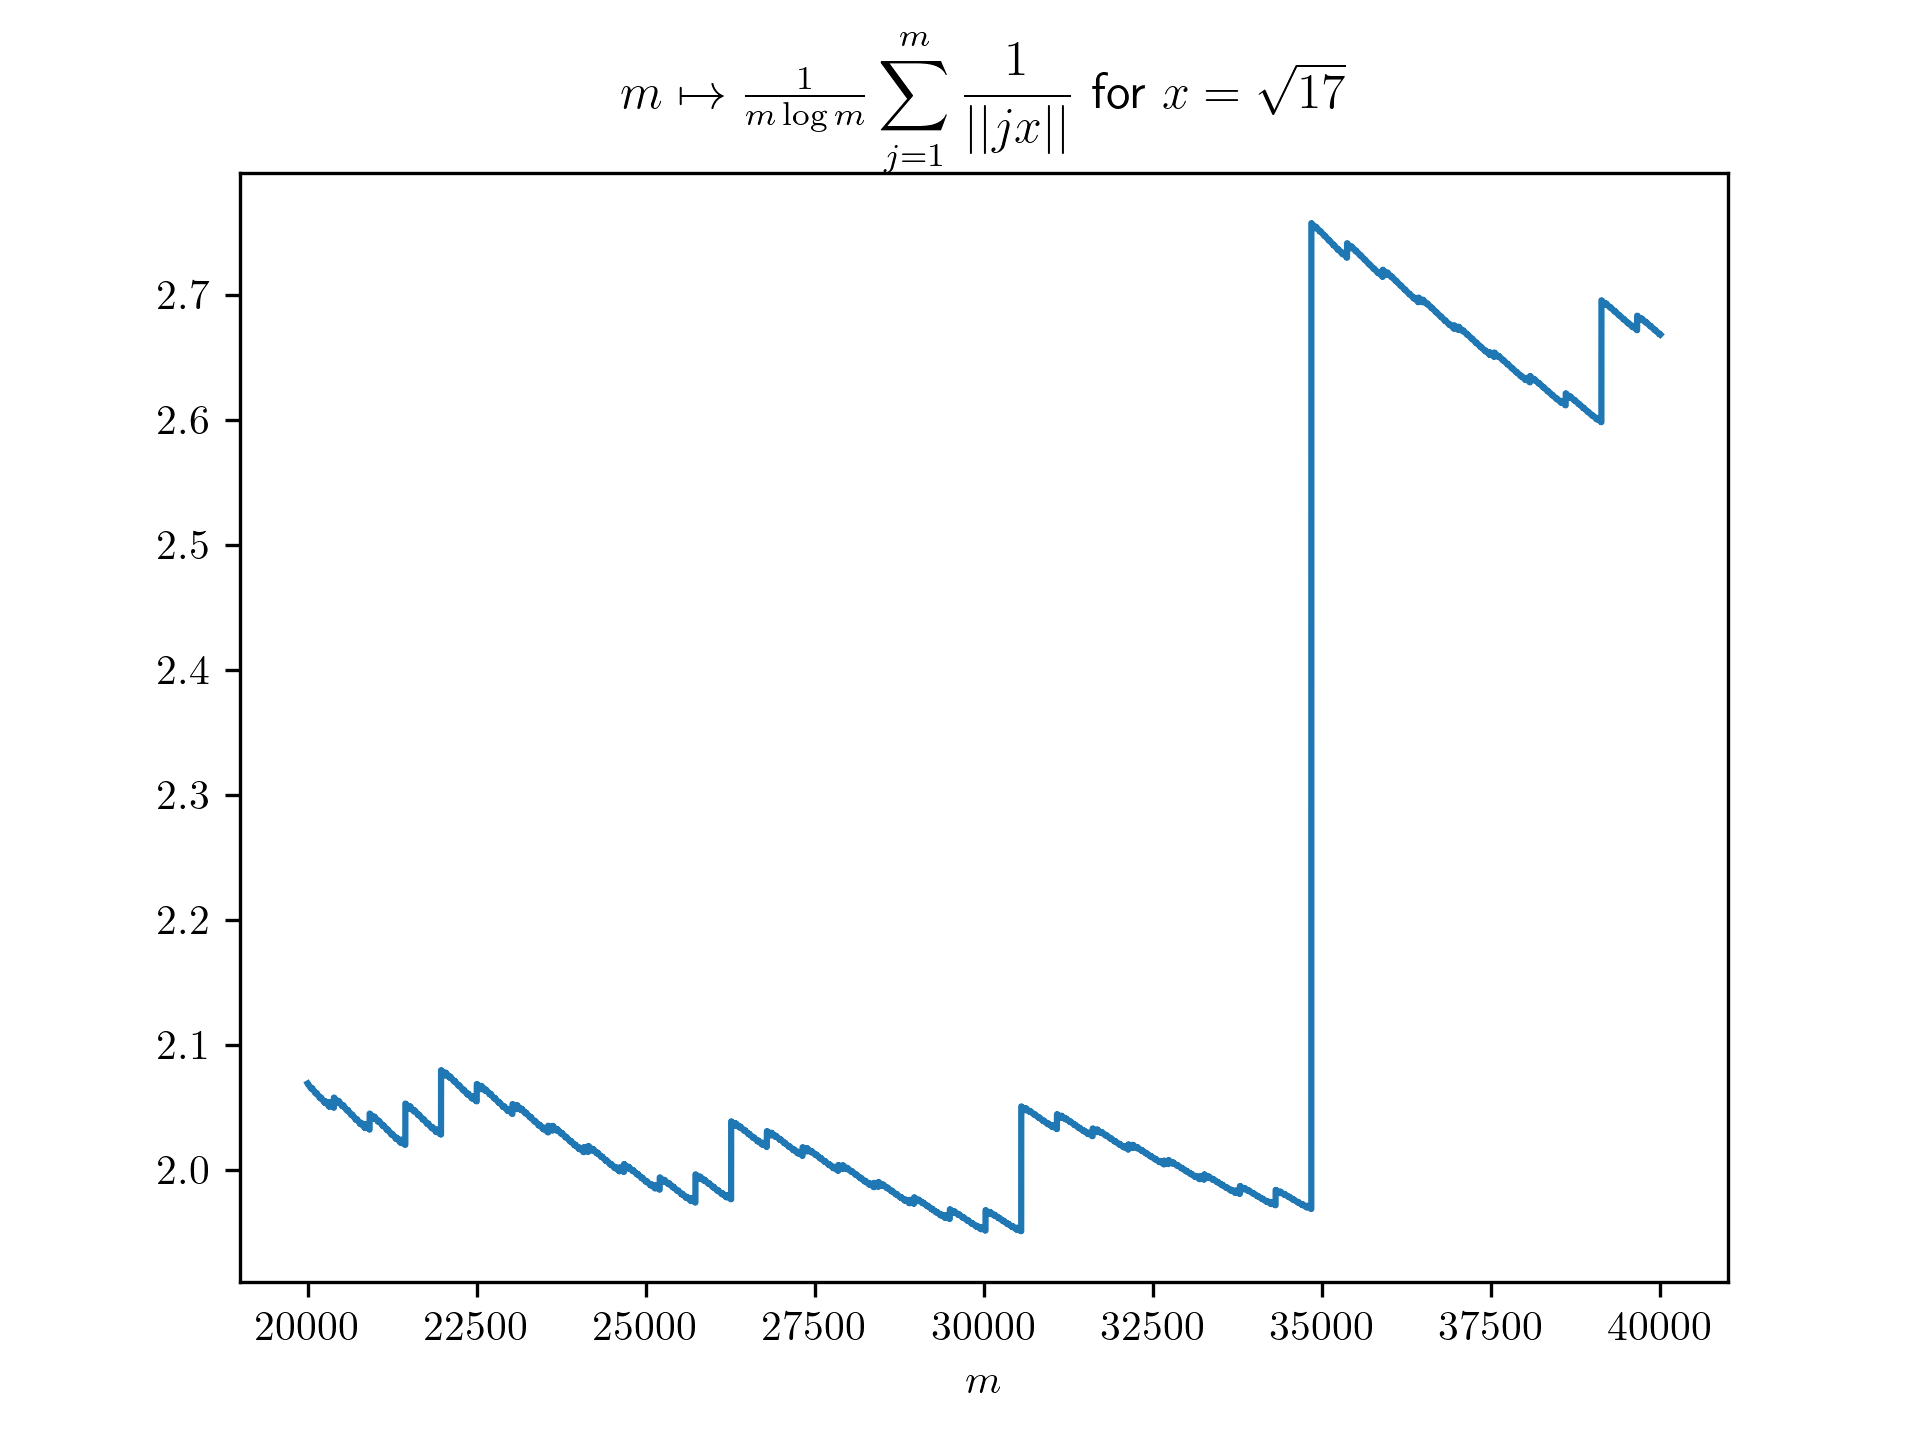
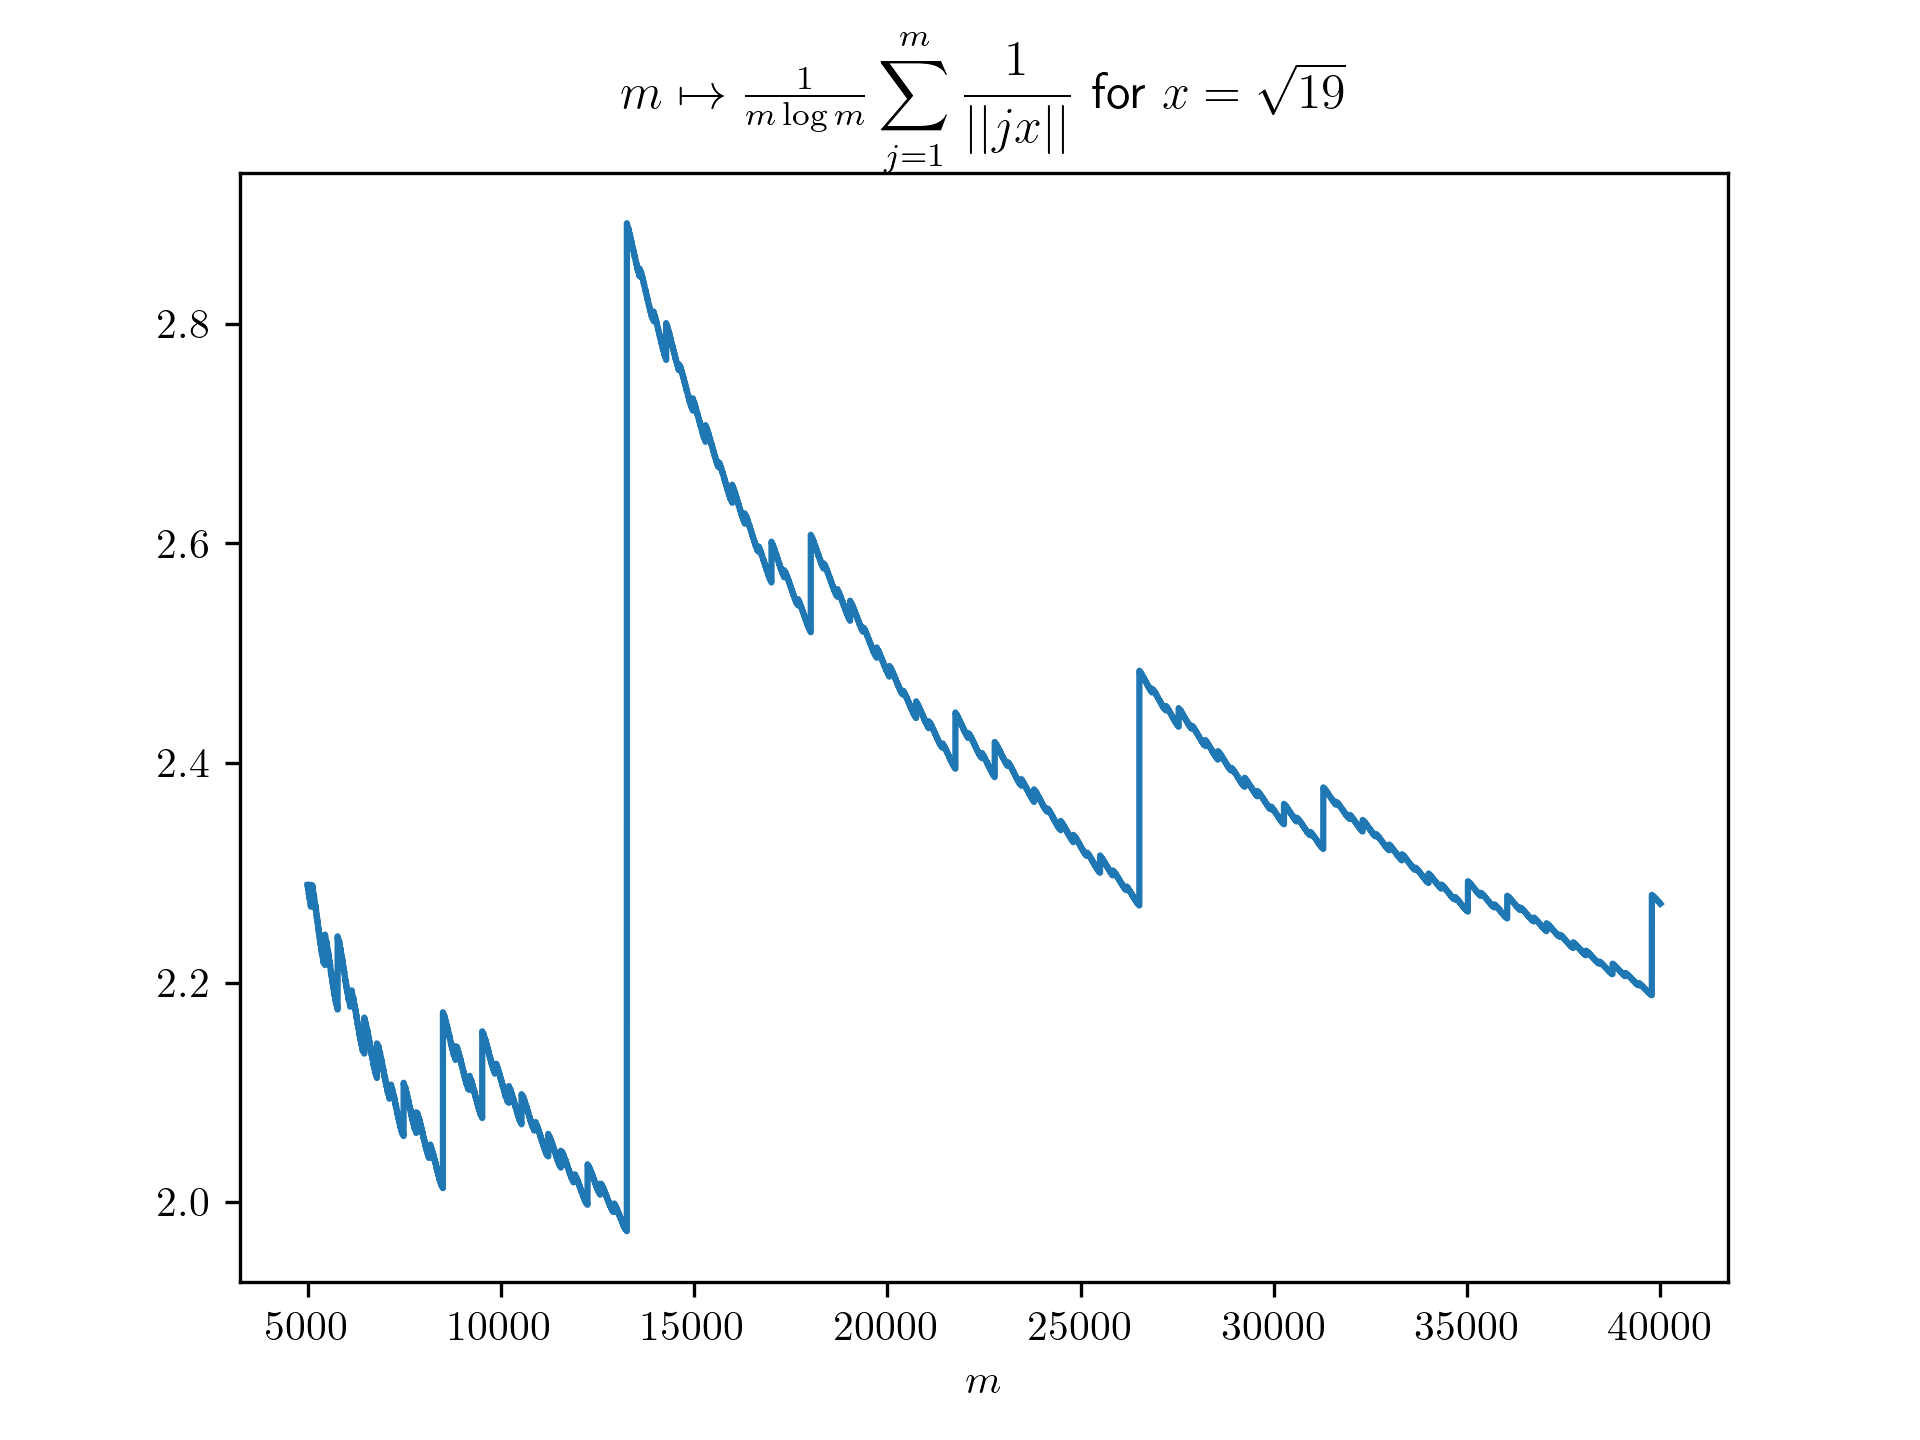
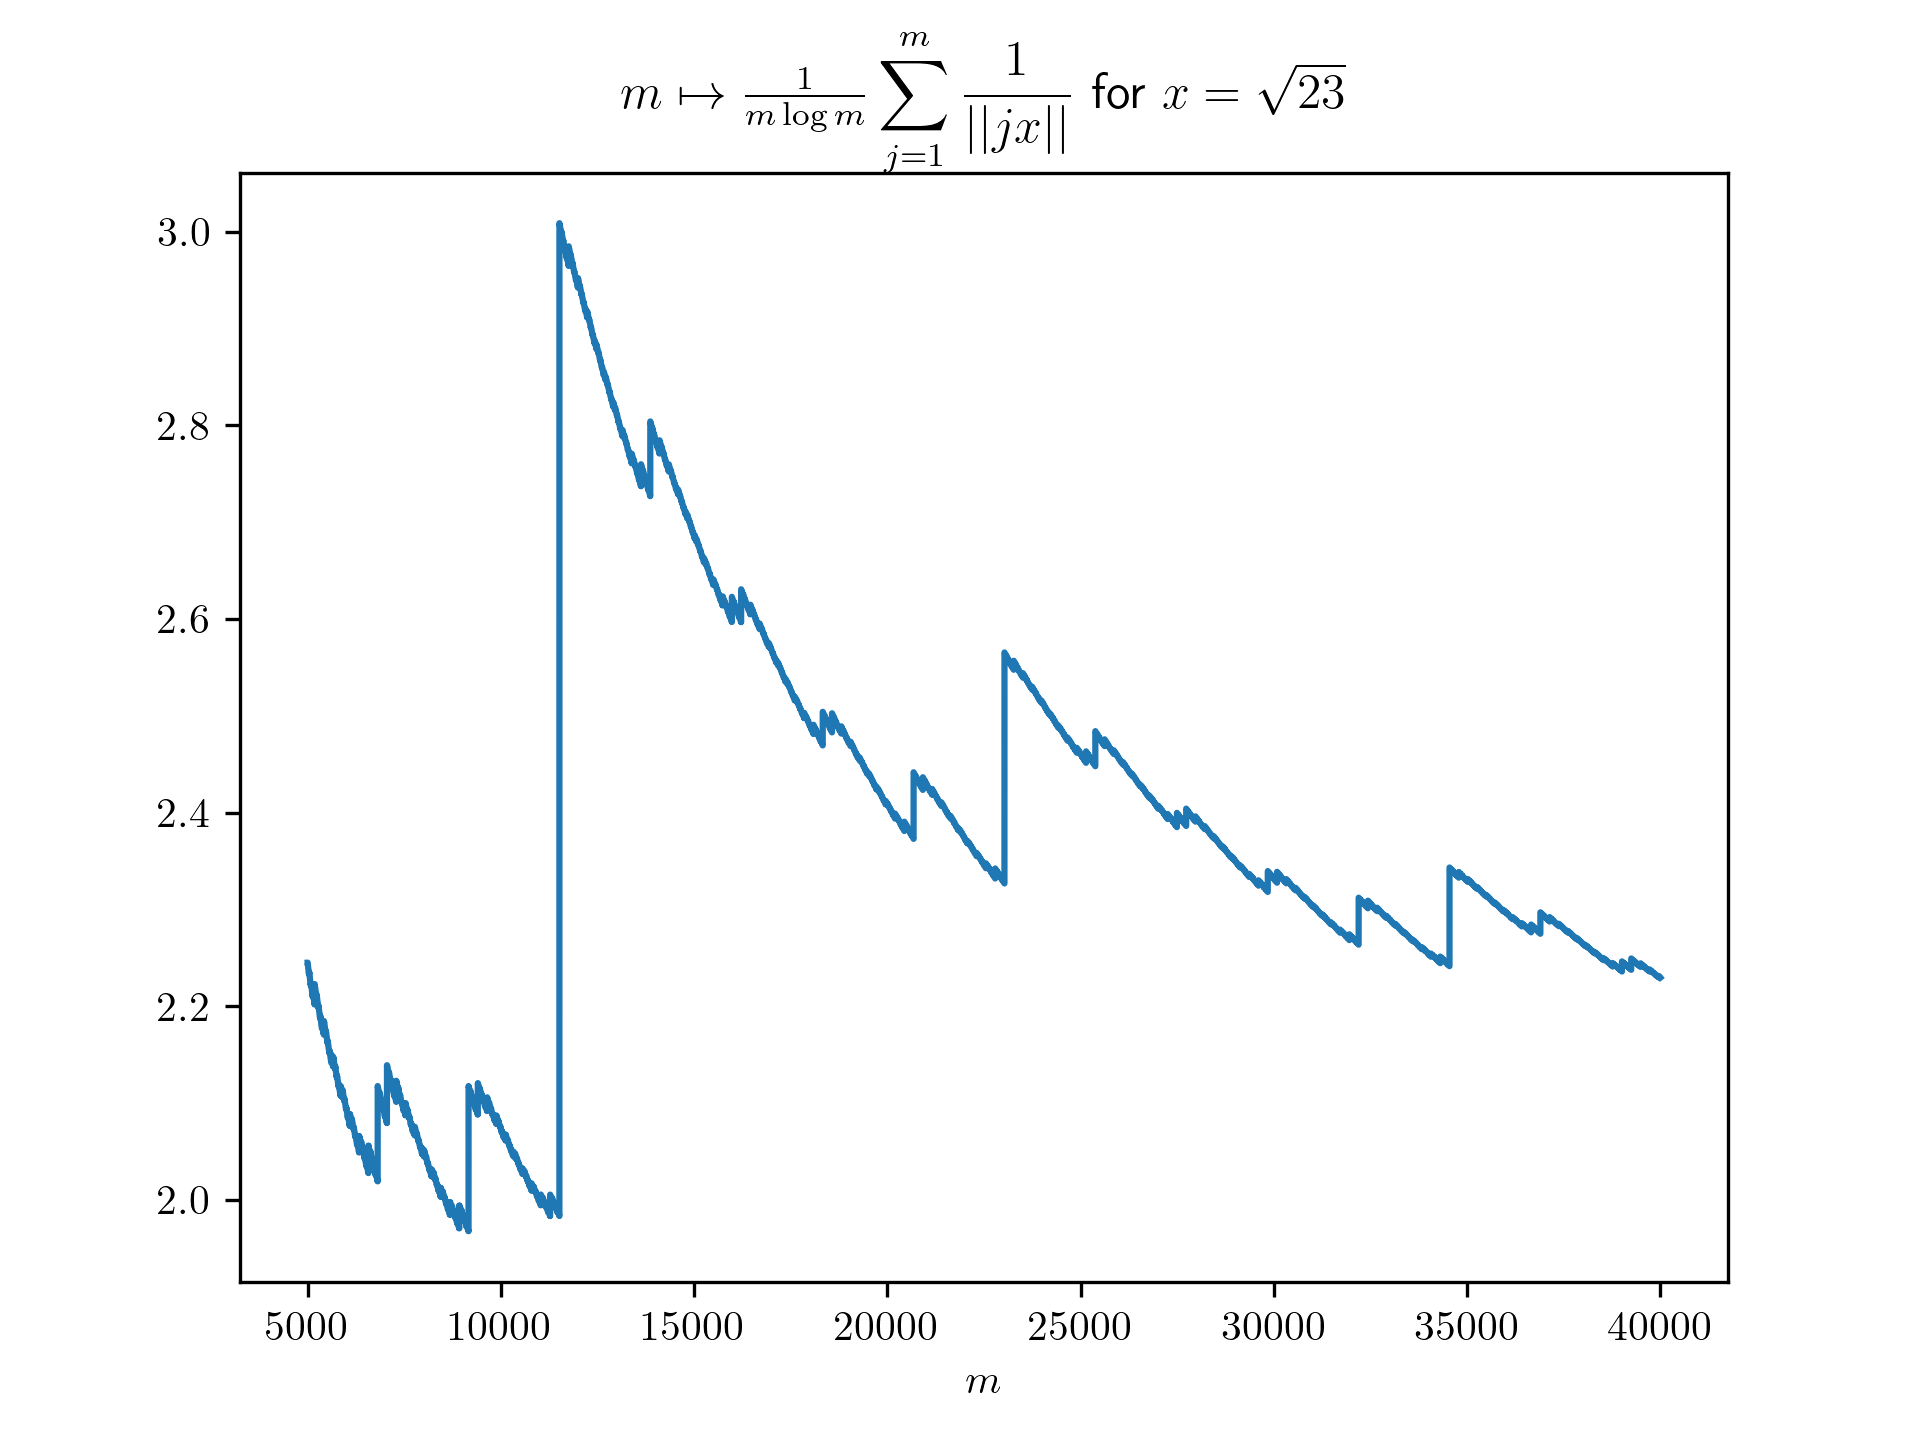
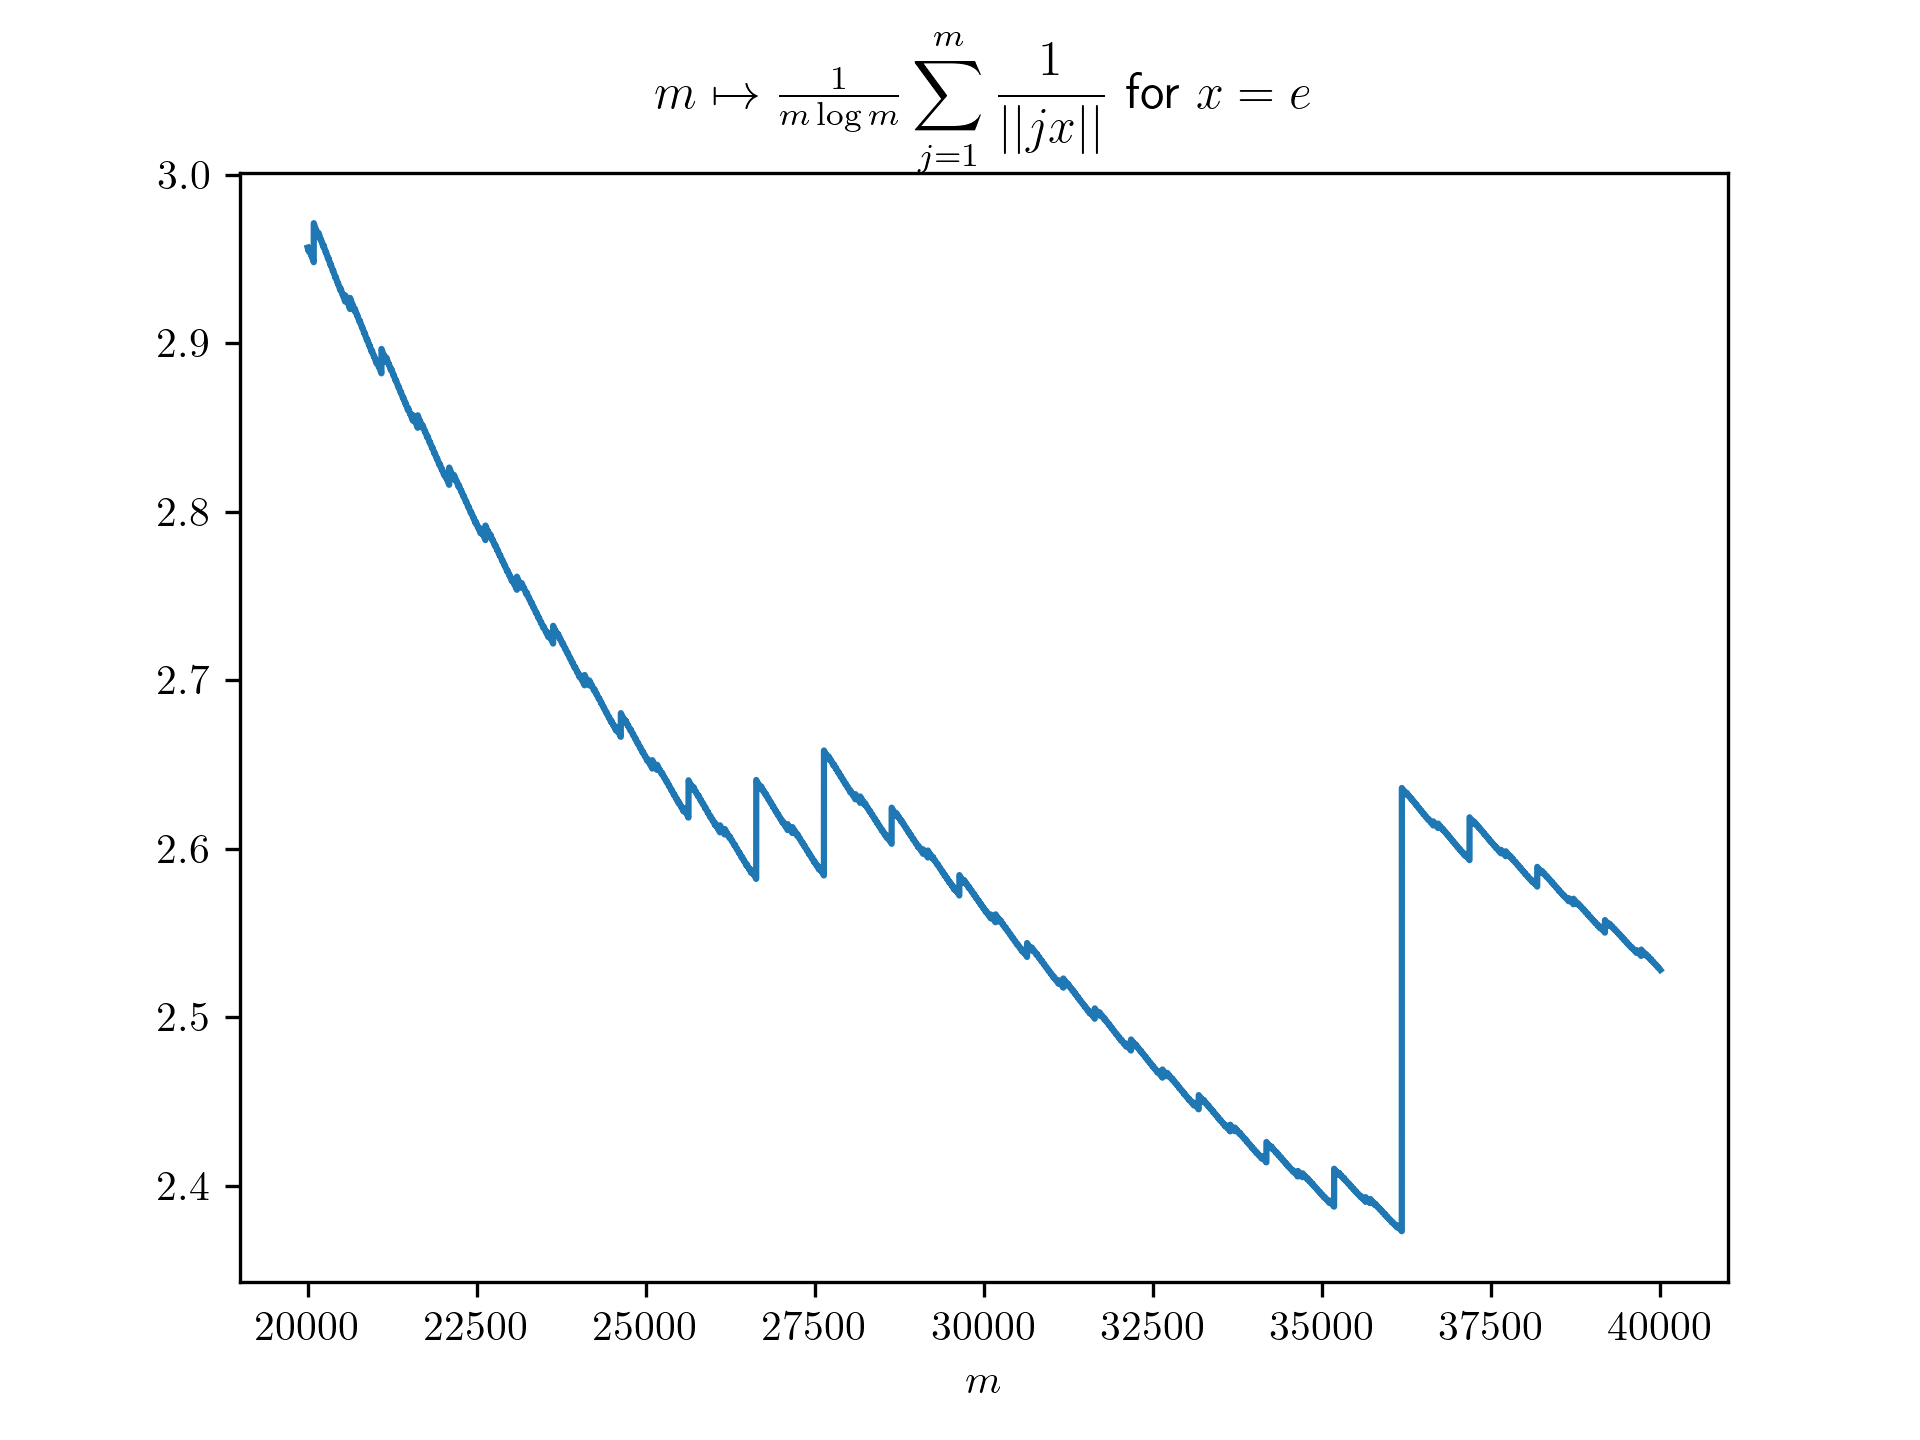
def f(m, x):
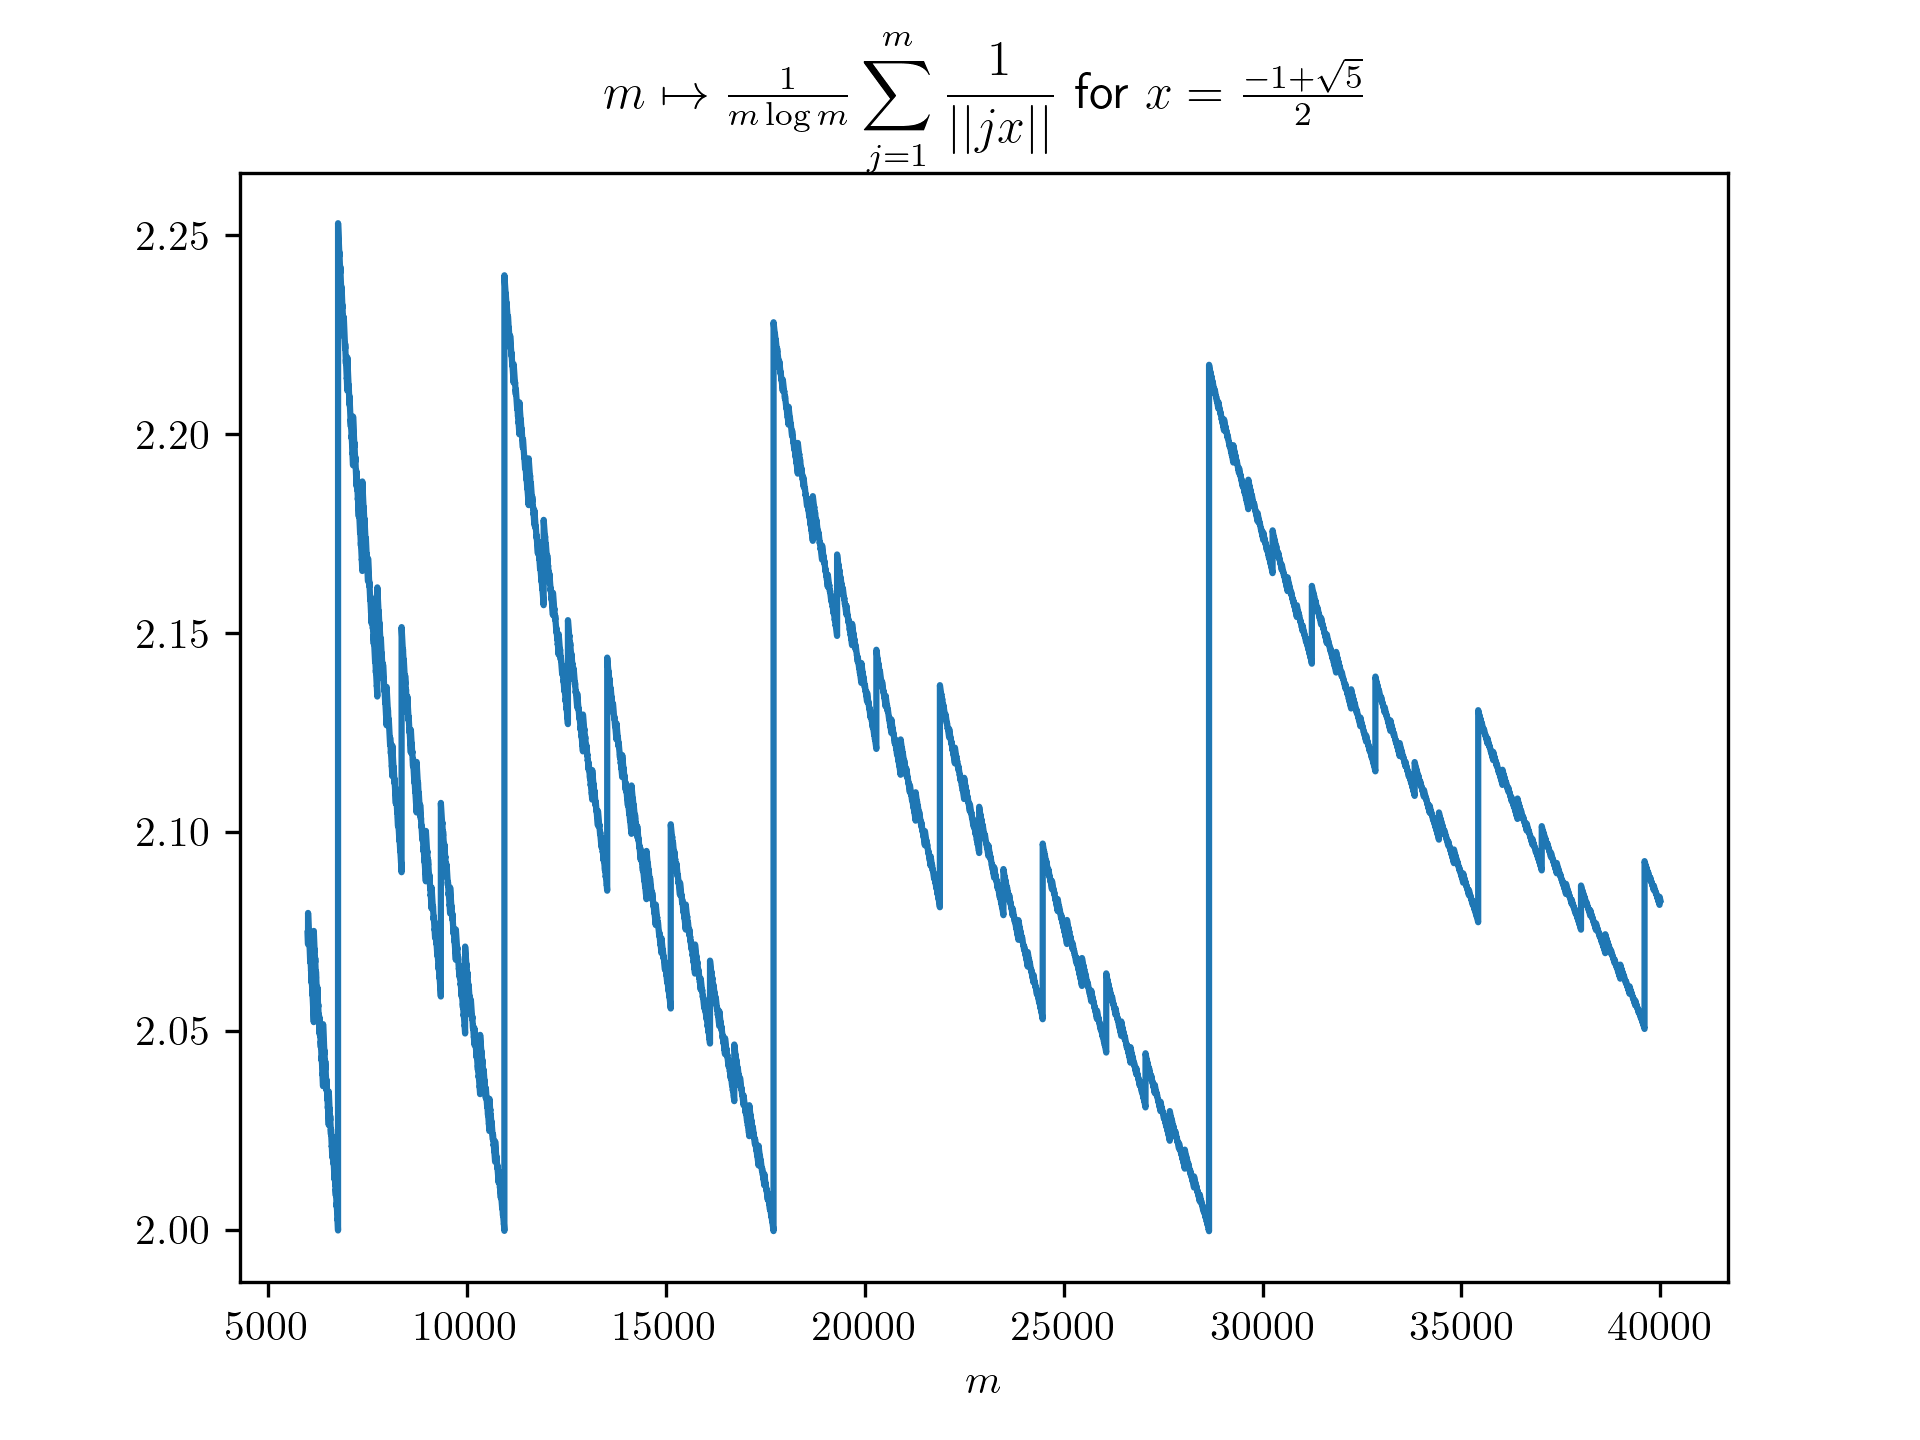
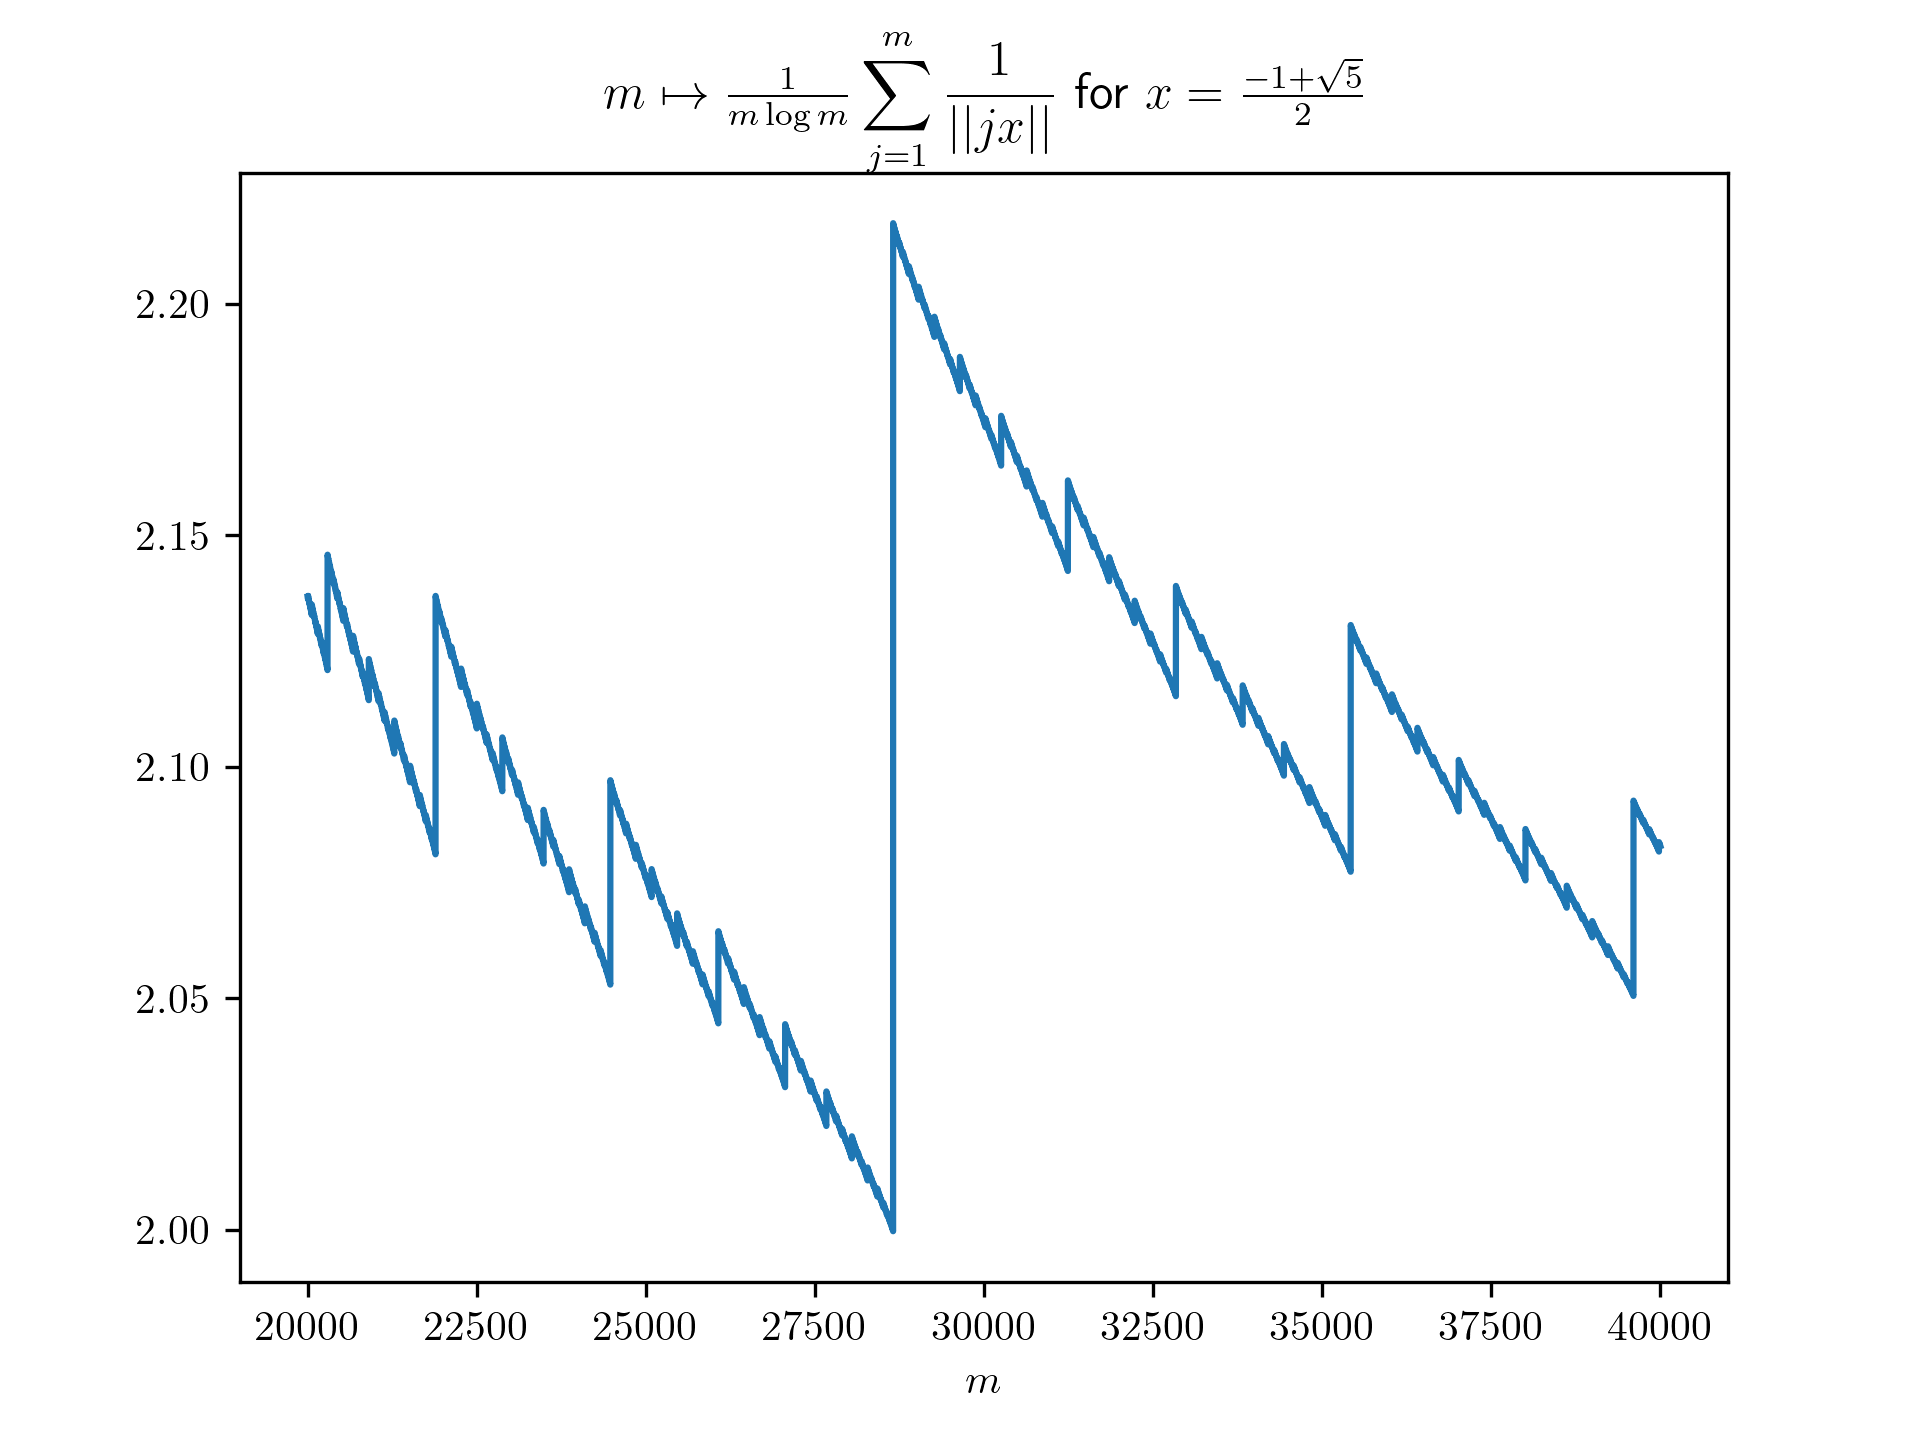
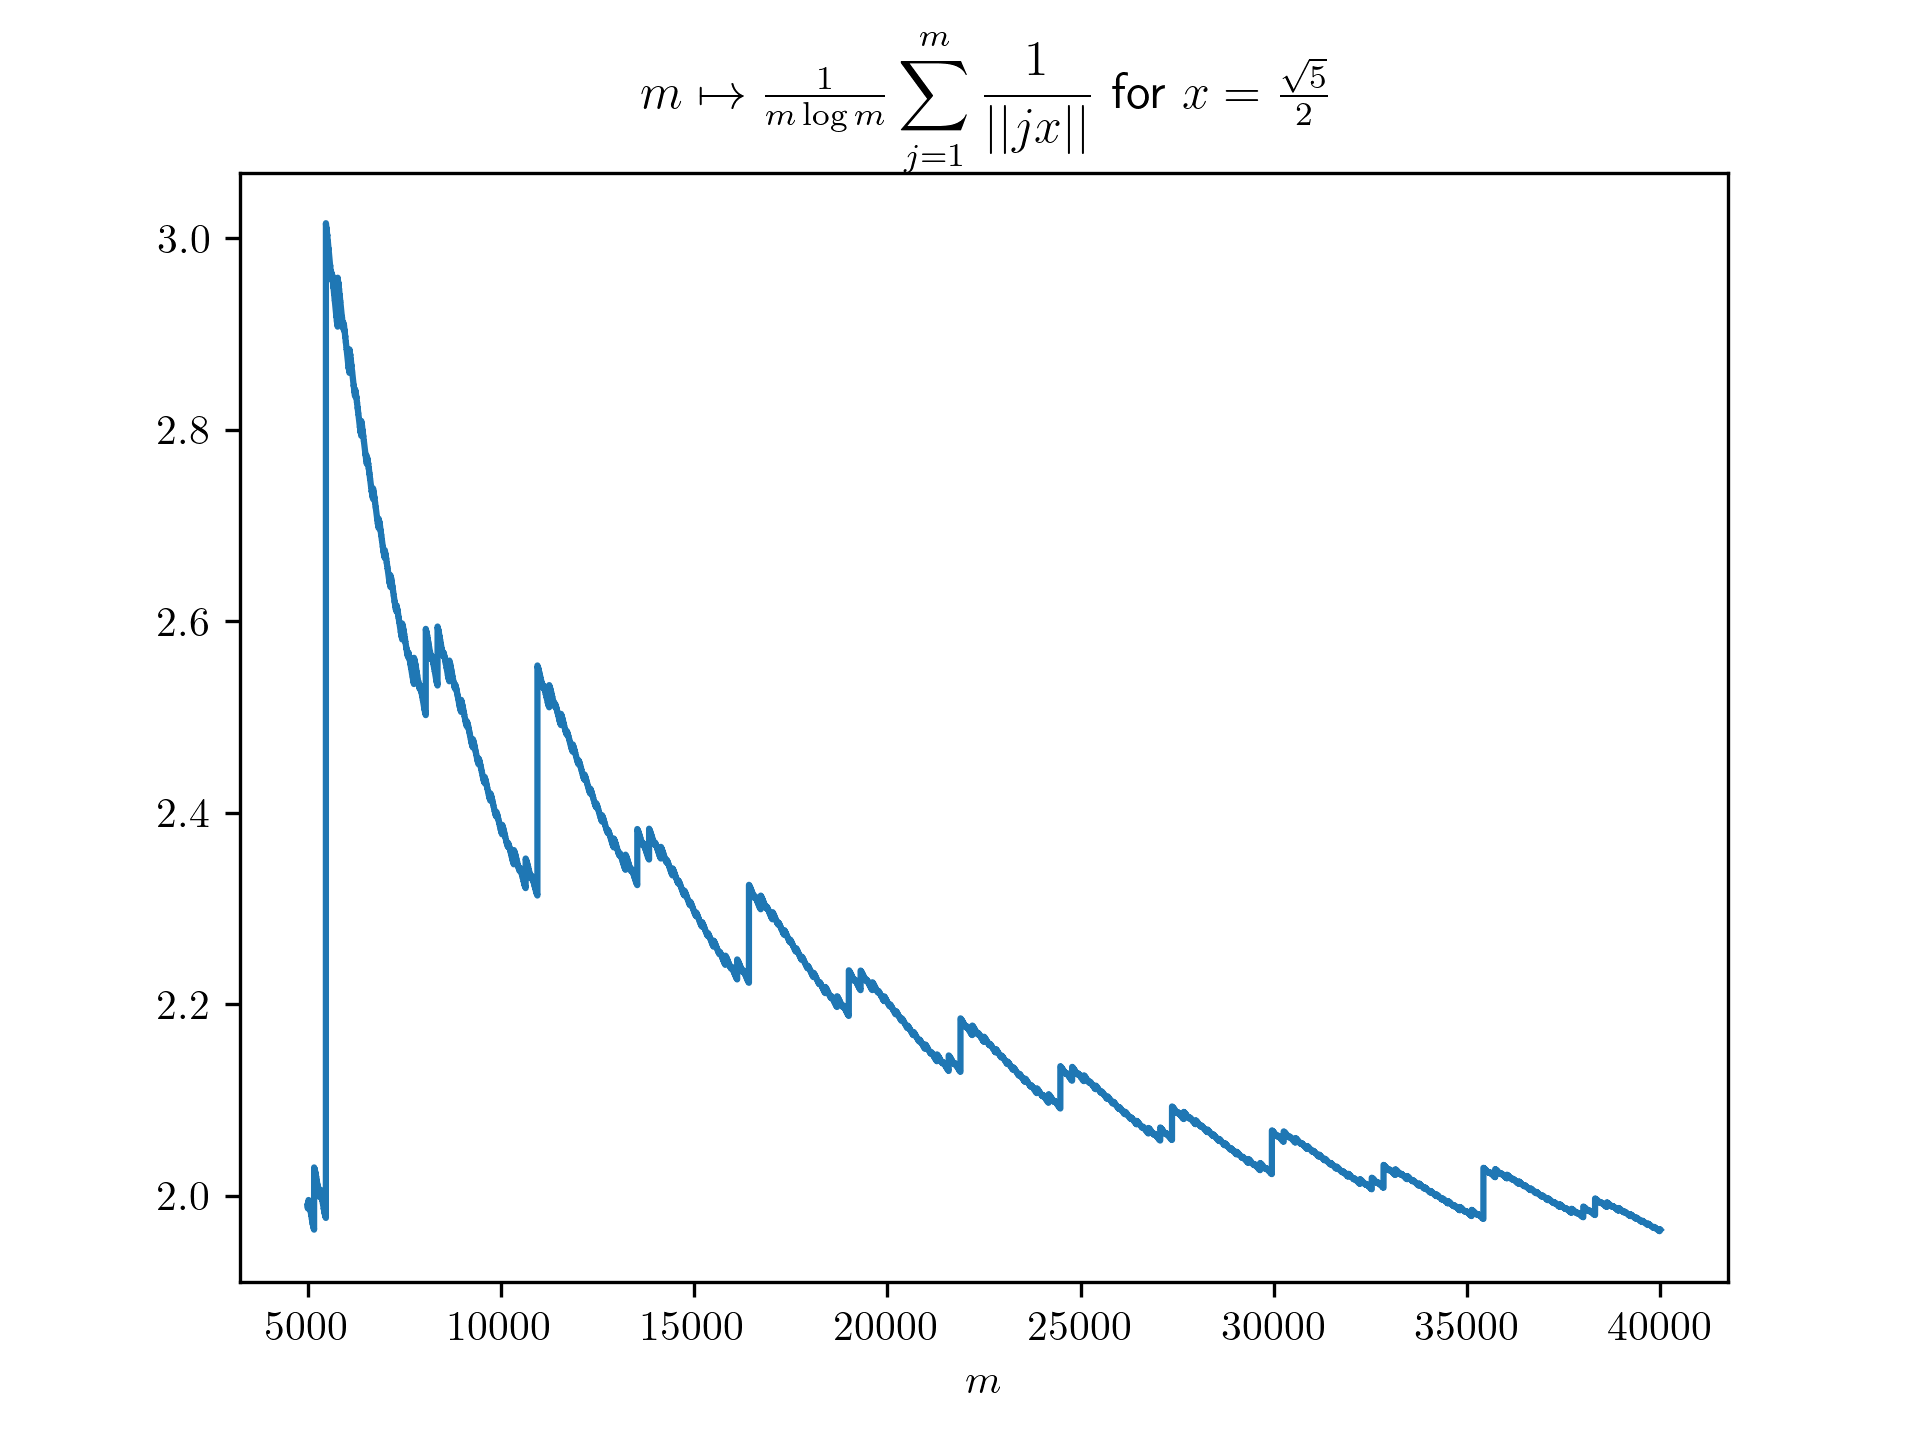
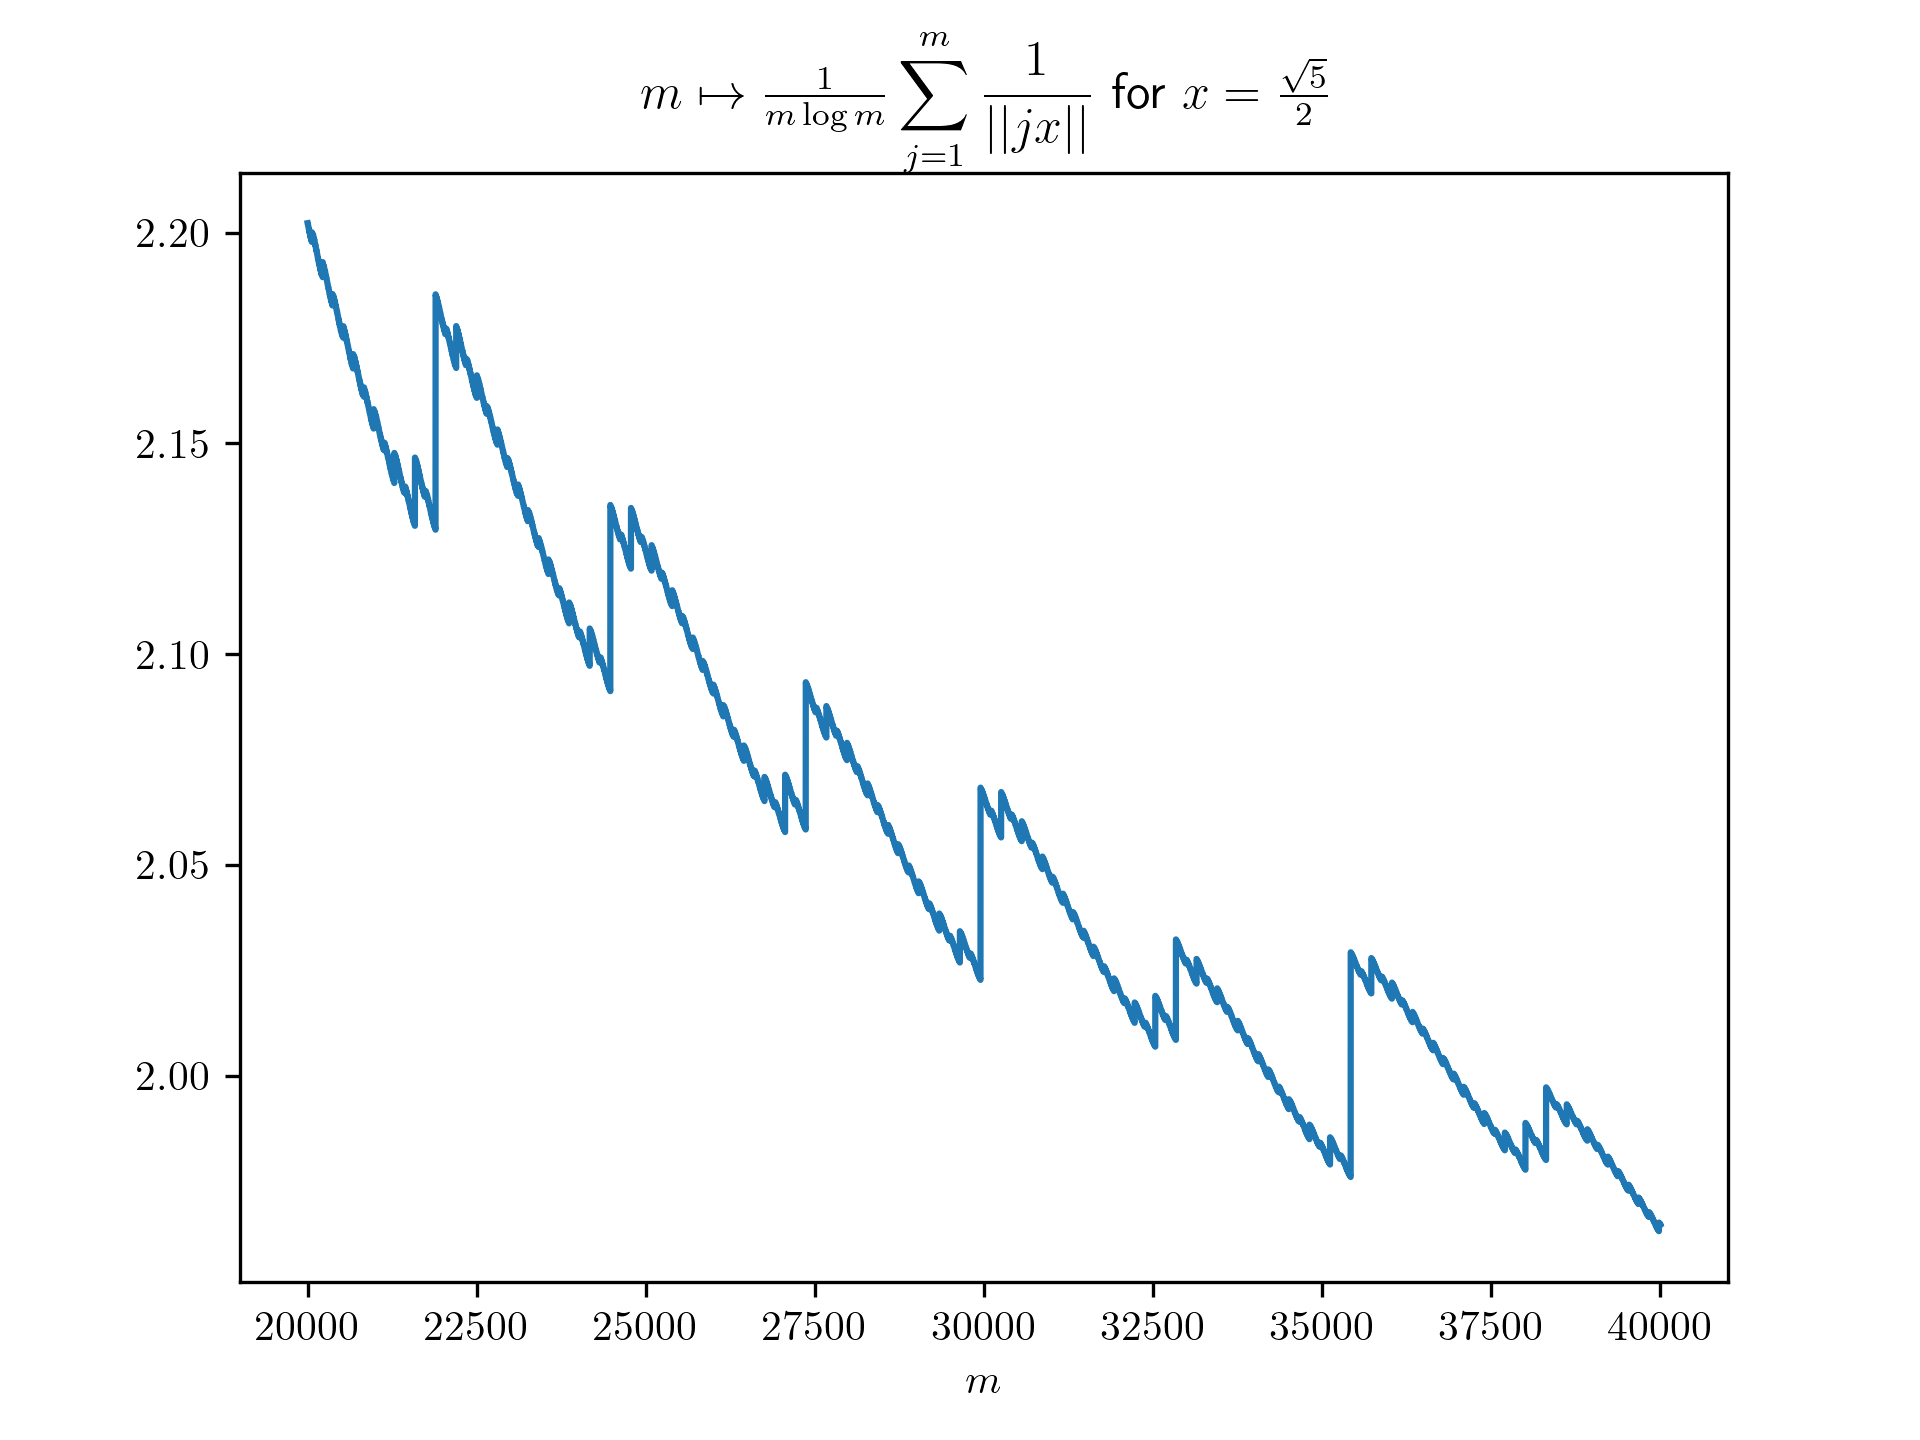
return 1/(m*math.log(m)) * sum([1 / int_dist(j*x) for j in range(1,m+1)])
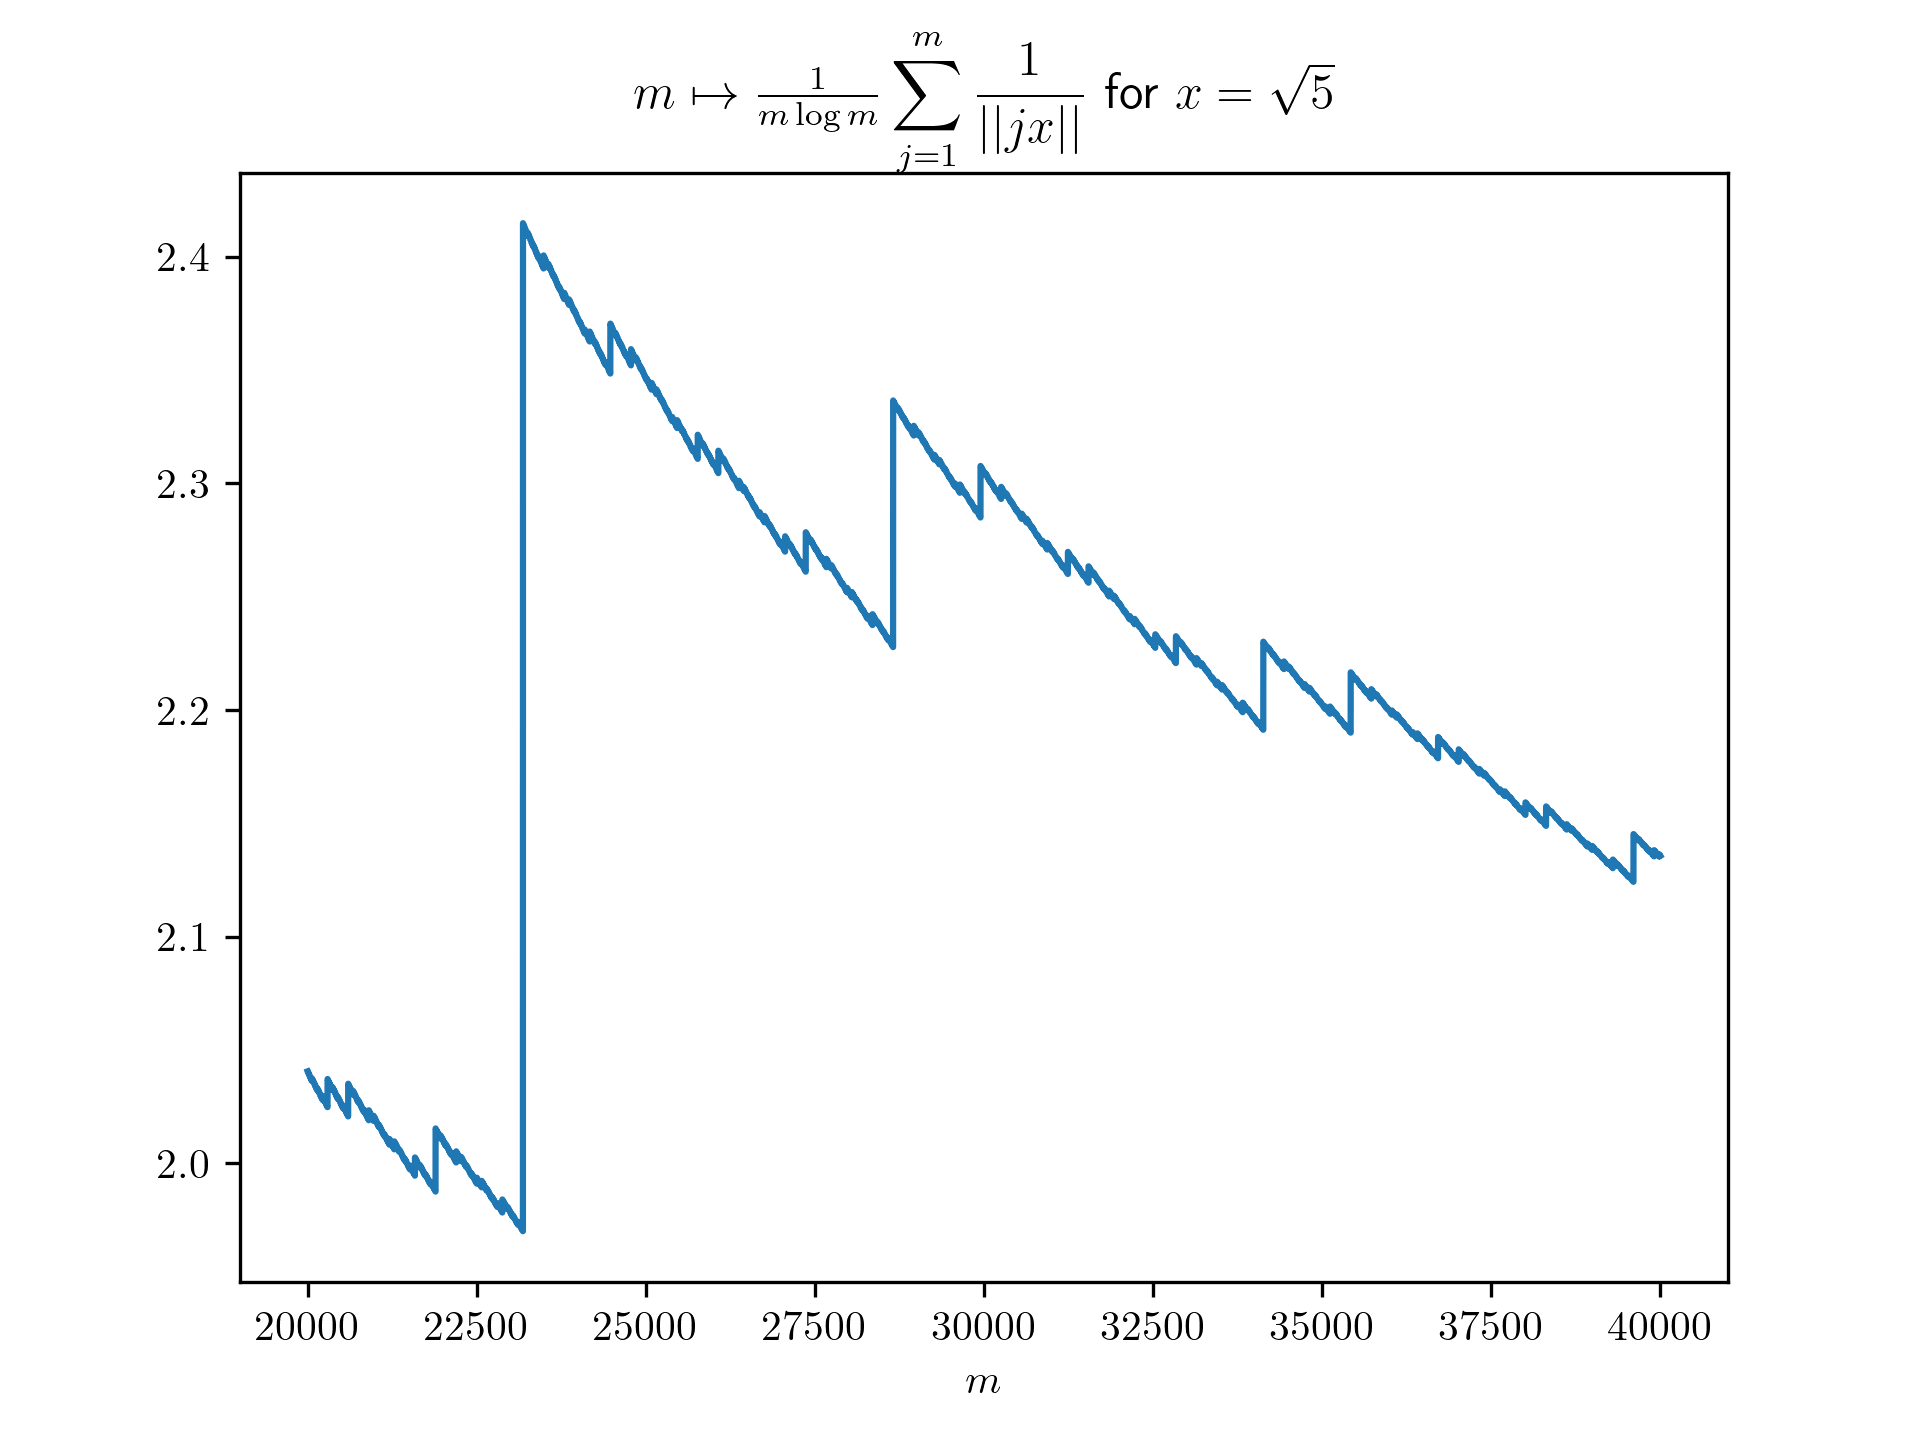
X20000_40000 = range(20000,40000+1)

Y20000_40000_g = [f(m,(-1+math.sqrt(5))/2) for m in range(20000,40000+1)]
plt.rcParams['text.usetex'] = True
plt.plot(X20000_40000, Y20000_40000)
plt.xlabel(r'$m$')
plt.title(r'$m \mapsto \frac{1}{m \log m}\displaystyle \sum_{j=1}^m \frac{1}{\vert \vert jx \vert \vert}$ for $x=\frac{-1+\sqrt{5}}{2}$')
plt.savefig('m20000_40000.png', dpi=300)
Let \(\vert \vert x \vert \vert\) be the distance from \(x \in \mathbb{R}\) to \(\mathbb{Z}\), that is, the distance from \(x\) to the nearest integer.
\(\vert \vert x \vert \vert\) = int_dist(x)