Sea surface currents derived from OSCAR
“How to plot Ocean Currents with Cartopy”. Reply by Jody Klymak. Oct 20, 2019
Ocean Surface Current Analyses Real-time (OSCAR)
NASA Earth Science Data Systems (ESDS)
import xarray as xr
import numpy as np
import cartopy.crs as ccrs
import matplotlib.pyplot as plt

with xr.open_dataset('oscar_vel2020.nc.gz') as ds:
    print(ds)

    plt.figure(figsize=(18, 9))

    ax = plt.axes(projection=ccrs.PlateCarree()) # plate carrée projection

    dec = 10

    lon = ds.longitude.values[::dec]

    lon[lon > 180] = lon[lon > 180] - 360

    mymap = plt.streamplot(
        lon,
        ds.latitude.values[::dec],
        ds.u.values[0, 0, ::dec, ::dec],
        ds.v.values[0, 0, ::dec, ::dec],
        8,
        transform = ccrs.PlateCarree()
    )

    ax.coastlines()

    plt.title('Sea surface currents derived from OSCAR')

    plt.savefig("currents18x9.png", dpi=150)

    plt.show()
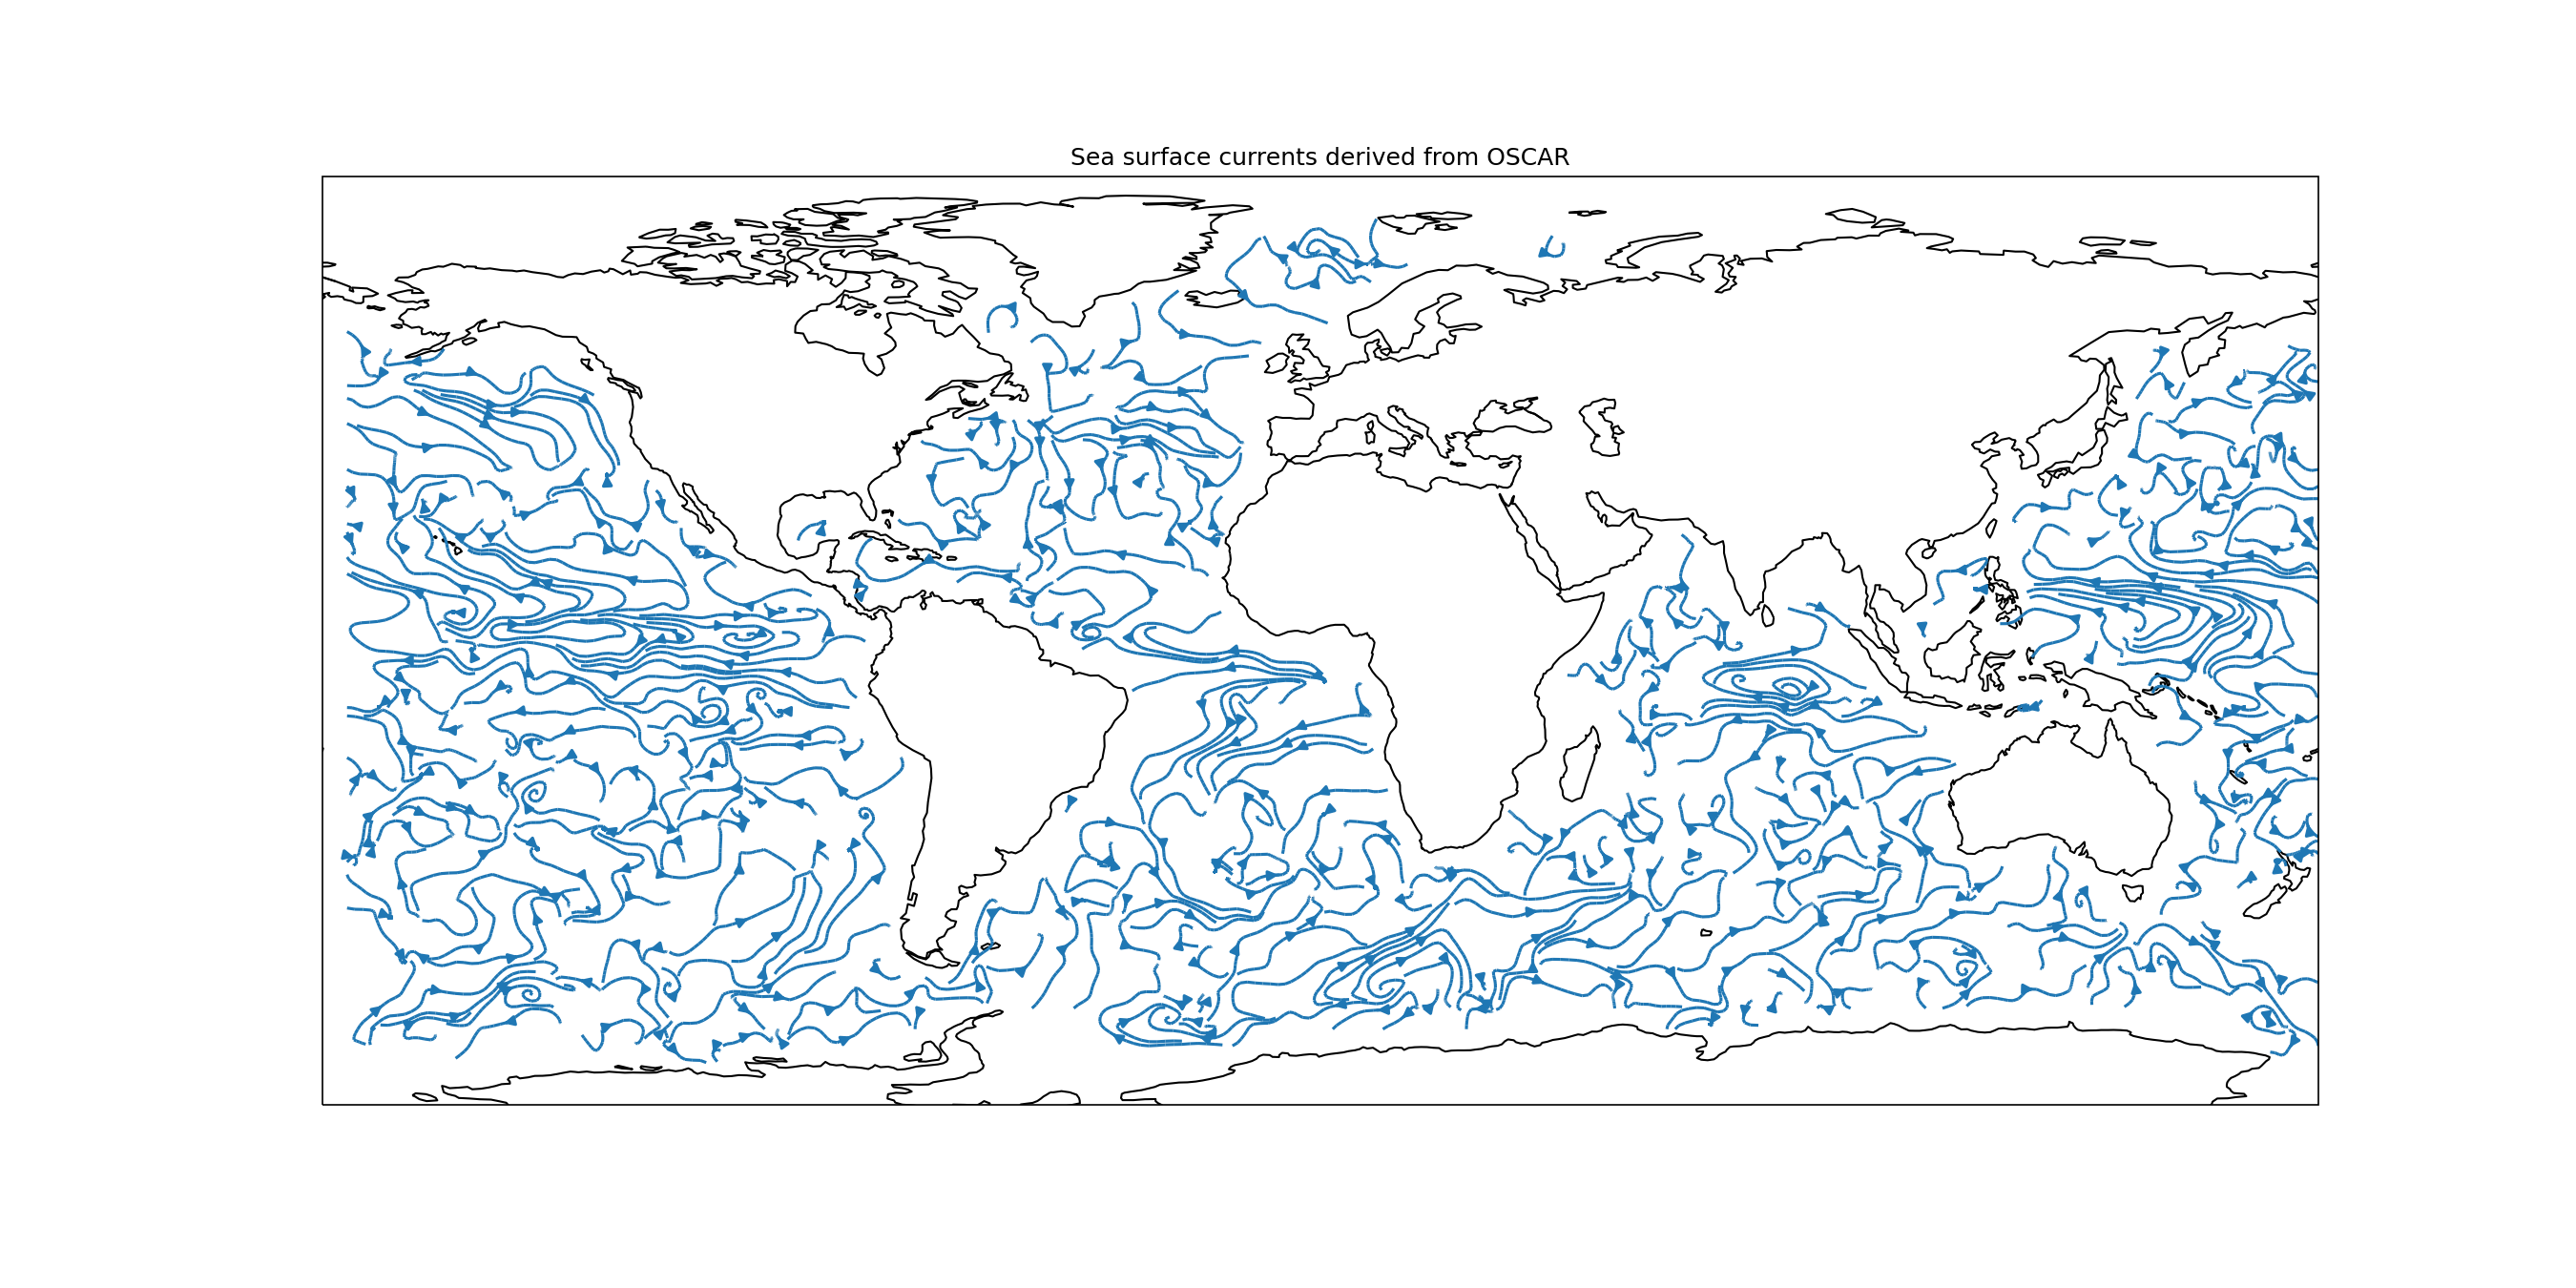
Plot of sea surface currents derived from OSCARhttps://t.co/5Iu2lKWMEK
— Jordan Bell (@jordanbell2357) December 15, 2022
Lightly modified from https://t.co/YhpAEexiNr
libraries used: numpy, xarray, cartopy, matplotlib pic.twitter.com/g9PmEdpATC
Mastodon
DEV
https://dev.to/jordanbell2357/sea-surface-currents-derived-from-oscar-2ln1